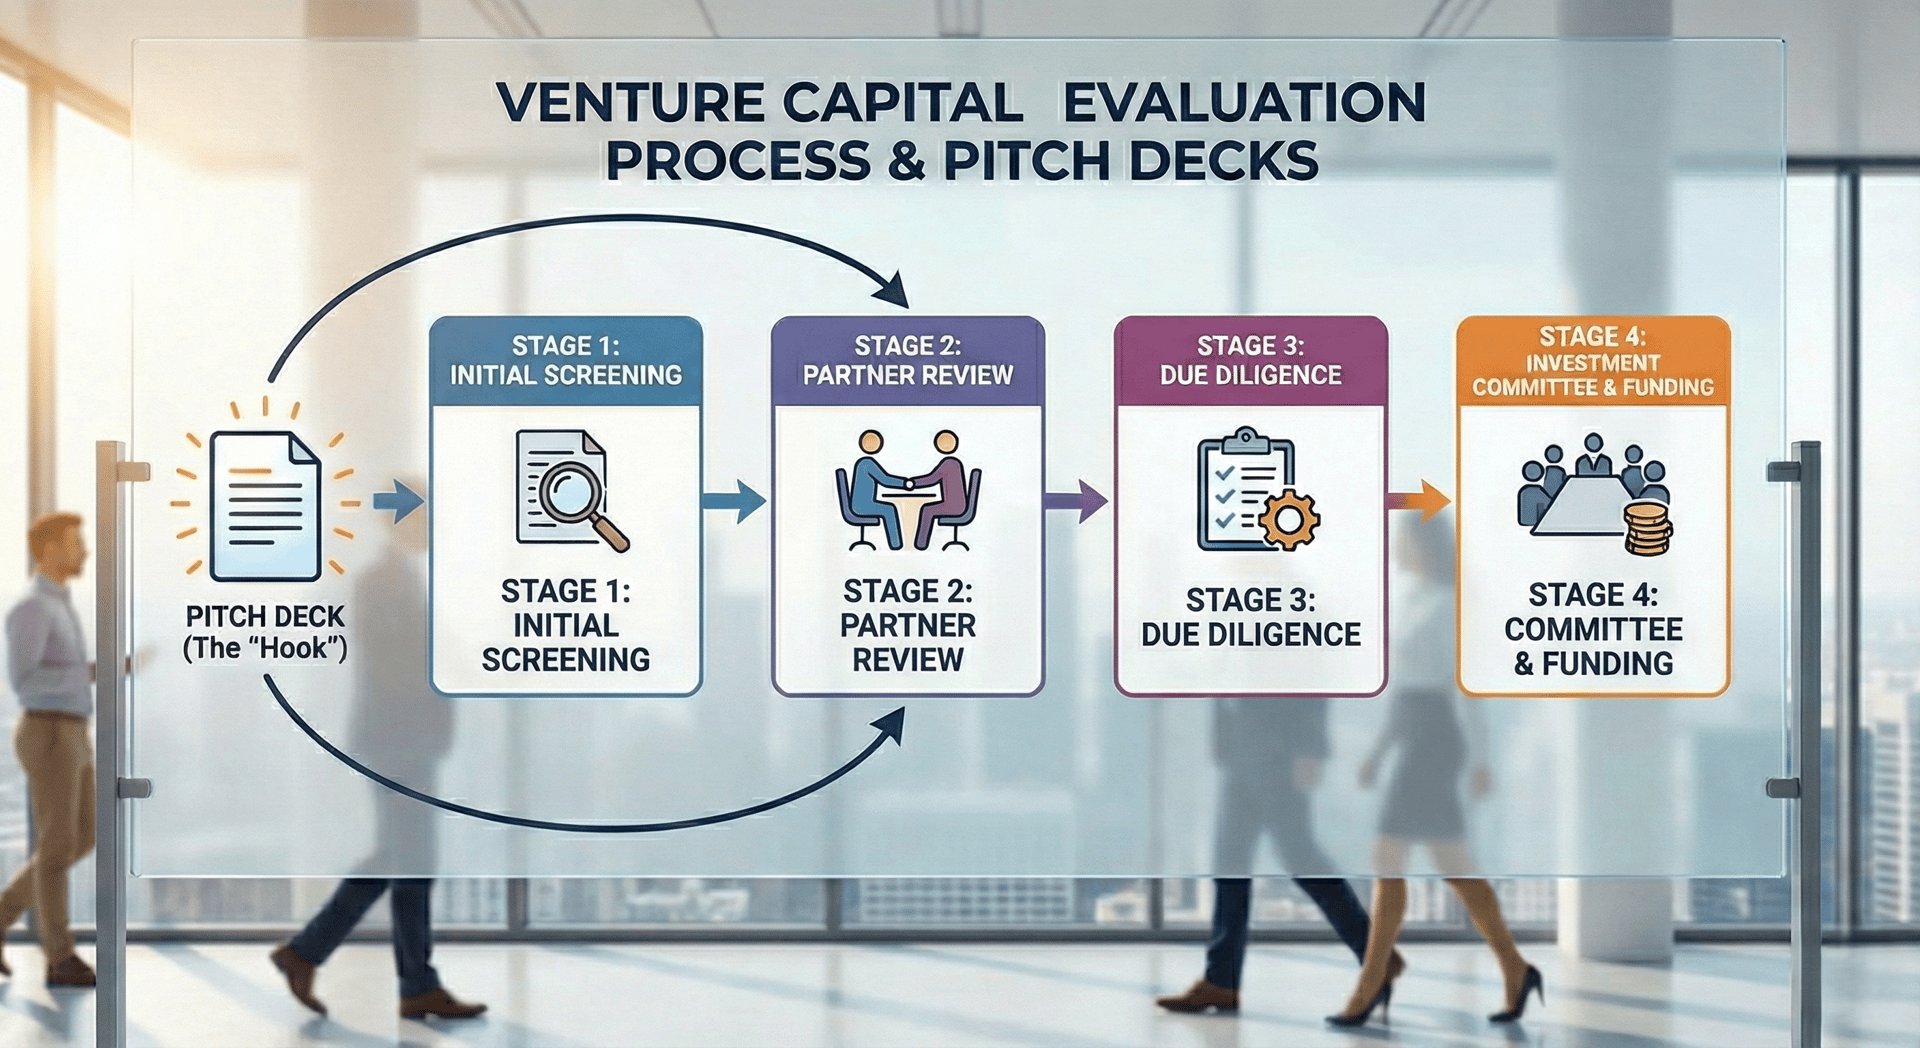
How Pitch Decks Fit Into the Venture Capital Evaluation Process
The VC evaluation process is a "Negative Filter." Your deck doesn't raise capital; it buys 20 minutes. A forensic audit on surviving the "Analyst Screen" and avoiding the "Operational Inefficiency" red flag.
1.1: WHAT A VC PITCH DECK ACTUALLY IS?
1/14/20266 min read
The Asset Is Not The Deck
If you believe your pitch deck is designed to secure funding, you have already failed the first audit of your capital raise. This is a fundamental misunderstanding of the venture capital asset class. Your deck does not get you a wire transfer; it buys you exactly 20 minutes of a General Partner's attention. That is the only currency that matters in the early stages.
Most founders treat the deck as a comprehensive autobiography of their startup. This is a liability. To an institutional investor, a dense deck signals an inability to prioritize. We are not looking for a story; we are looking for a risk-adjusted return profile that fits our fund’s thesis.
You must understand the hierarchy of materials. As discussed in What a VC Pitch Deck Actually Is (and What Investors Mean When They Ask for One), the document you send is merely a "gate key." If the key doesn't fit the lock instantly, we don't jiggle the handle. We walk away. The evaluation process is a ruthless filtration system, and your deck is the filter's primary input variable. If the input is noisy, the output is a rejection.
The Forensic Diagnosis: Why "Comprehensive" Decks Trigger Immediate Passes
When a Series A startup submits a 25-slide deck filled with dense paragraphs and "visionary" jargon, it triggers a specific forensic red flag: Operational Inefficiency.
The "Red Flag" Scenario
Imagine a Partner at a Tier-1 firm opens your deck on a Tuesday morning. They have 40 other decks in their inbox. They open yours. Slide 1 is a generic title. Slide 2 is a "Mission Statement" about changing the world. Slide 3 is a "History of the Industry."
The VC’s Internal Monologue: "This founder doesn't understand my job. I need to know the ARR, the MoM growth, and the burn rate. I have to dig through five slides of narrative to find the numbers. If their deck is this disorganized, their Board meetings will be a nightmare."
The deck is closed. No meeting.
The Psychological Audit
Why do intelligent founders commit this error? It is usually rooted in Insecurity disguised as Thoroughness.
Founders fear that if they leave out a detail, the investor won't "get it." This is a cognitive distortion. You are attempting to mitigate the risk of rejection by over-supplying information.
High-functioning founders understand that VCs are pattern-matching machines. We are looking for specific signals:
Team Pedigree: Ex-Stripe/Google?
Traction: >$1M ARR? 3x YoY growth?
Market Size: TAM >$5B?
If these signals are buried under "fluff," the pattern match fails. We assume you are hiding weak metrics behind strong adjectives.
The Probability Decay Function
Your pitch deck is not a brochure; it is a structural bridge designed to cross a mathematical chasm. Most founders view funding rounds as linear steps up a ladder. This is false. They are exponential filters.
Let’s look at the Survival Probability of a startup. This is where the "Death Valley" curve becomes lethal.
The "Funding Chasm" Stats:
Seed to Series A Drop-off: ~80% of companies fail to graduate.
Series A to Series B Drop-off: ~50% of companies fail to graduate.
Series B to C Drop-off: ~40% of companies fail to graduate.
The role of the pitch deck changes fundamentally at each stage to combat this decay.
The "Wrong Tool" Error
The primary reason for the 80% mortality rate at Series A is that founders use a "Seed Deck" strategy for a "Series A" problem.
Seed Stage Variable: "Possibility." You are selling the dream, the team, and the MVP. The math is loose.
Series A Stage Variable: "Repeatability." We are no longer funding the experiment; we are funding the machine that scales the experiment.
If your Series A deck focuses on "Vision" rather than "Unit Economics," you are bringing a knife to a gunfight.
The Valuation Impact Formula:
The deck's job is to prove you have crossed the chasm from "Project" to "Business."
Valuation = Current ARR X Growth Multiple X (1 - Execution Risk)
A weak deck increases the perceived Execution Risk variable. If the investor cannot clearly see how $1 in equals $3 out, the Execution Risk approaches 1.0, and your Valuation approaches zero. The deck must mathematically prove that the "Machine" works, thereby reducing risk and justifying the capital injection.
The "Insider" Solution Protocol: The 3-Stage Evaluation Fit
To survive the VC evaluation process, you must engineer your deck to perform specific functions at three distinct stages of the funnel. A single static PDF is rarely sufficient. You need a modular approach.
Phase 1: The "Teaser" (The Analyst Screen)
Objective: Survive the 3-minute skim.
Audience: Associate / Junior Analyst.
Function: Check the boxes for Thesis Fit and Metrics Thresholds.
The Fix:
Slide Count: Maximum 10-12 slides.
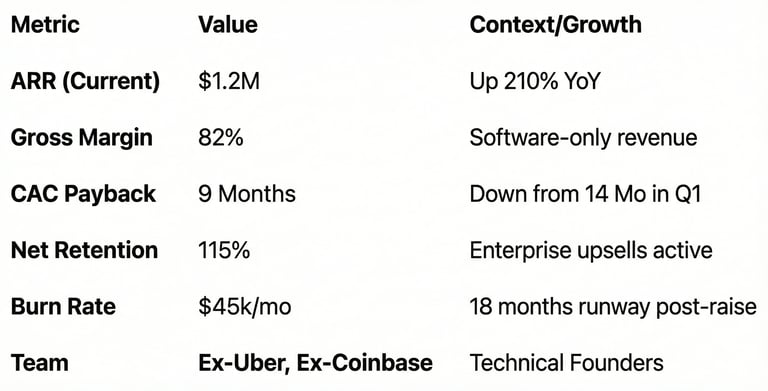
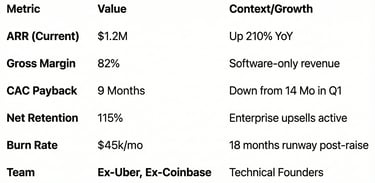
The "North Star" Slide: Immediately following the title slide, include a "Highlights" slide. This is the single most important slide in the deck.
[The North Star Wireframe]
Do not make the investor hunt for data. Layout the slide exactly like this:
Why this works: The Analyst can copy-paste these six data points directly into their CRM or internal Slack channel ("Deal Huddle"). You have done their work for them.
Visual Cue: Use large, bold fonts for the numbers ($1.2M) and smaller, grey fonts for the context labels.
Phase 2: The "Presentation Deck" (The Partner Meeting)
Objective: Drive the narrative and defend the valuation.
Audience: General Partner (GP).
Function: Facilitate a conversation, not a lecture.
The Fix:
Visuals over Text: Remove 80% of the text from your Teaser deck.
The "We Are Here" Framework:
Weak Version: A slide listing 10 product features.
VC-Ready Version: A graph showing the "Product Roadmap" mapped against "Capital Utilization." Show exactly what the Series A cash buys (e.g., "Feature X unlocks Enterprise Segment Y, moving LTV from $10k to $50k").
Phase 3: The "Data Room" Deck (Due Diligence)
Objective: Validate the claims.
Audience: Investment Committee / External Auditors.
Function: Mathematical proof of the business model.
The Fix:
Appendix Slides: This is where the detail goes.
Cohort Analysis: Include the raw retention curves.
CAC Payback: Show the calculation (Gross Margin adjusted).
Equation: Use the "Burn Multiple" formula explicitly:
Burn Multiple = Net Burn
Net New ARR
Show that your Burn Multiple is decreasing as you scale. Ideally, <2.0 for Series A.
Before vs. After: The "Market" Slide
Weak Version: A pie chart showing "$500B Global Software Market."
VC Reaction: "Lazy. They don't know their actual Serviceable Obtainable Market (SOM)."
VC-Ready Version: Bottom-up calculation.
"There are 50,000 mid-market manufacturing firms in the US."
"x $20k ACV per firm."
"= $1B Beachhead Market."
VC Reaction: "Precise. Actionable. Verify the ACV, and we have a deal."
The "Death Traps": How Founders Over-Correct
In an attempt to appear "data-driven," founders often swing the pendulum too far, creating new liabilities.
1. The "Fake Precision" Trap
Do not project revenue to the decimal point for Year 5. Showing "$105,432,100" in revenue for 2029 signals that you are hallucinating. Round numbers indicate you understand these are estimates. Precise numbers indicate you are deluding yourself.
2. The "Hidden Ask" Trap
Never bury the "Ask" slide at the end. In the evaluation process, the VC needs to know the price of admission immediately. If you are raising $15M at a $60M pre-money valuation, state it early. If that is outside the fund's check size, you are wasting everyone's time by hiding it until Slide 15.
3. The "Product Demo" Trap
Do not put a 3-minute video link inside a PDF. It will break, or they won't click it. Use screenshots with annotations. If the product cannot be explained in three static frames, the UI/UX is likely too complex for mass adoption.
The "High-Ticket" Conclusion: Optimize for Yield
The venture capital evaluation process is a financial machine, not a literary critique. Your pitch deck is the primary lever for conversion rate optimization within this machine. By restructuring your deck to align with the forensic habits of VCs—optimizing for speed, clarity, and metric visibility—you effectively lower the friction to capital.
Fixing this structure does not just get you a meeting; it frames the negotiation. A precise deck signals a precise operator, which commands a valuation premium. For a full breakdown of the ecosystem, review How VC Pitch Decks Really Work in 2026 — And Why Most Founders Get Them Wrong.
The Filter: You can attempt to reverse-engineer these slides manually, guessing at the narrative flow. Or, you can utilize "The Slide-By-Slide VC Instruction Guide" included in our $5k Consultant Replacement Kit. It contains the exact structural templates required to survive the Analyst screen and the Partner audit.
The kit is $497 and available on the home page. If your time is worth less than the hours required to build this from scratch, do not buy it.
Funding Blueprint
© 2026 Funding Blueprint. All Rights Reserved.