Market Size (TAM / SAM / SOM) Fundamentals: The "Trillion-Dollar TAM" is a Signal of Strategic Failure
A trillion-dollar TAM is a signal of strategic failure, not success. Master the forensic bottom-up math for SAM and SOM. Learn the 'Hiring Friction' and 'Localization' secrets elite VCs in SF, NYC, and London demand.
PILLAR 8: MARKET SIZE & COMPETITION
12/30/20256 min read
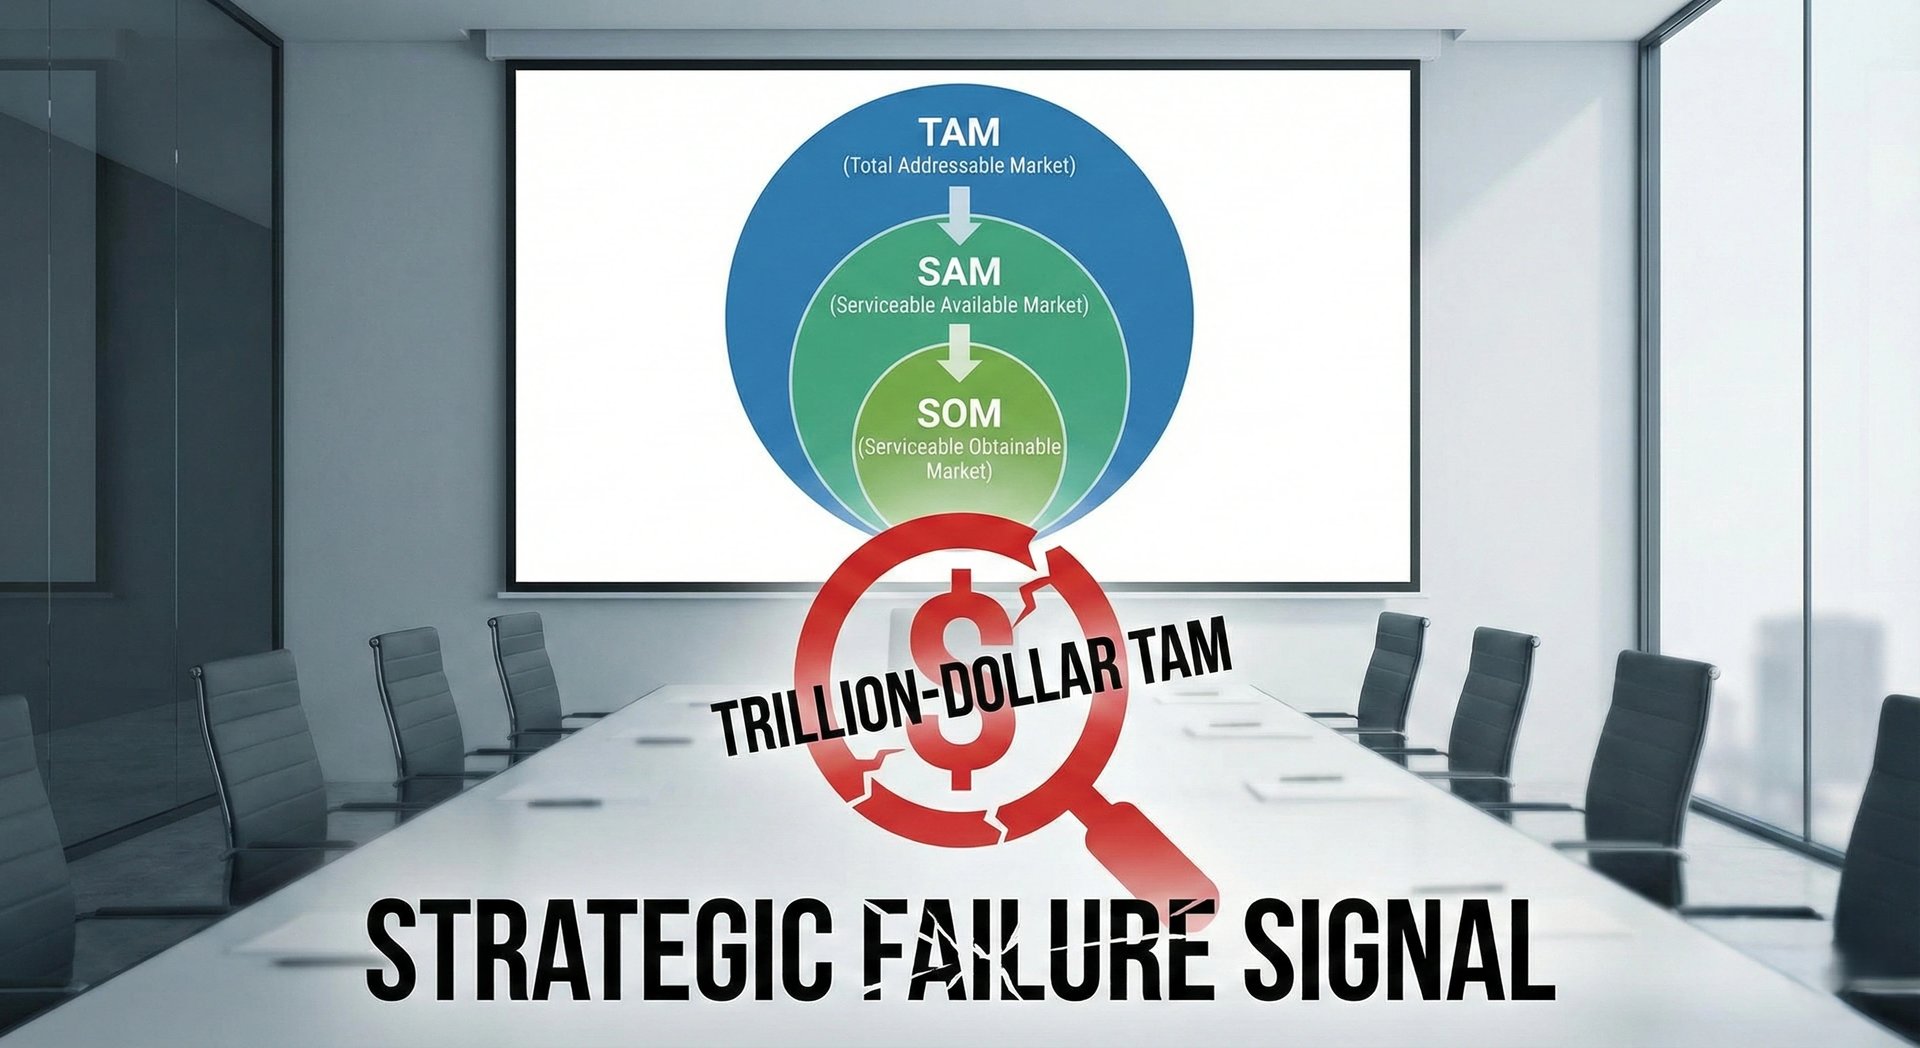
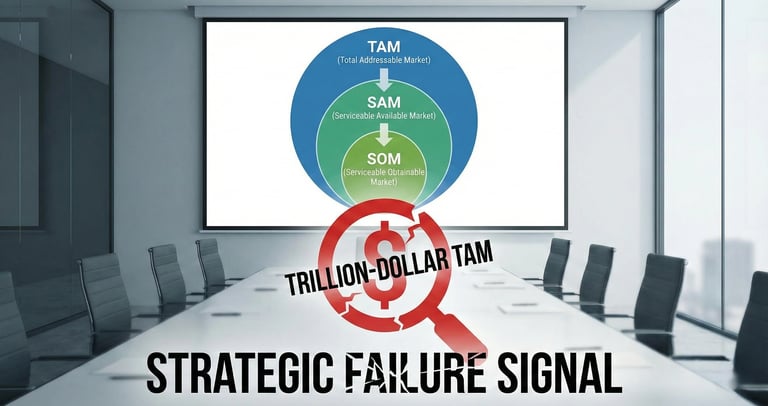
The "Trillion-Dollar TAM" is a Signal of Strategic Failure
Most founders believe a massive Total Addressable Market (TAM) excites investors. In the 2025 institutional environment, the opposite is true. An oversized TAM suggests a lack of Operational Grip and an inability to define a realistic customer profile. When a founder presents a "Trillion-Dollar Market," an elite investor doesn't see opportunity; they see Cognitive Load. They see a founder who hasn't done the surgical work required to understand where their first $10M in revenue actually originates.
Precision is the only proxy for truth in fundraising. If you cannot define your Serviceable Obtainable Market (SOM) with Metric Integrity, your valuation will be discounted by 40-60% as a "complexity tax."
This sub pillar is part of our main Pillar 8: Market Size & Competition
The Trench Report (The $22M Series B "Project Obsidian" Pivot)
In Q3 of 2024, I represented a London-based DevOps platform, "Project Obsidian," seeking a $22M Series B. Their initial pitch centered on a $120B TAM, encompassing the entire global cloud infrastructure spend.
The Structural Error: The lead NYC-based fund pointed out a fatal flaw during the first technical bridge. The founder had included "Public Cloud Egress Fees" in their TAM. Since Project Obsidian didn't capture a percentage of egress, only a per-node license fee, the market size was a "System 1" hallucination. It relied on fast, intuitive, but logically flawed associations. The investor’s internal model showed that even with 90% market dominance, the company could never reach $500M in ARR because the underlying "addressable" units were miscounted.
The Technical Pivot: We paused the roadshow for three weeks. We executed a "Forensic Market Rebuild." We moved from a top-down percentage model to a bottom-up "Seat-Based Capacity" model.
The Adjustment: We narrowed the SAM to "Series B+ Scale-ups using Kubernetes on AWS in North America and EMEA."
The Forensic Formula:
SAM = (Total Target Companies X Avg. Engineering Headcount) X (License Cost per Seat X Utilization Rate)
The Result: The TAM dropped from $120B to a "modest" $4.2B. However, the Metric Integrity was undeniable. Because we could prove exactly how many engineers existed in that segment and what their current "Pain-to-Pay" ratio was, the lead investor regained confidence. The deal closed at a $140M post-money valuation because the "path to 10% SOM" was mathematically certain, not purely speculative.
The Forensic Stack of Market Segmentation
To achieve a "10/10" score in Technical Due Diligence (DD), you must categorize your market using System 2 thinking—slow, effortful, and logical.
1. Total Addressable Market (TAM): The Theoretical Ceiling
TAM is not a sales target; it is a boundary. In 2025, investors look for "Market Deflationary Risk." If your TAM is $10B today, but AI-driven automation is reducing the cost of your service by 20% annually, your TAM is actually shrinking.
2. Serviceable Addressable Market (SAM): The Realistic Reach
SAM is defined by your current product-market fit (PMF). If your software only supports English and integrates only with Salesforce, your SAM excludes 40% of the global market.
3. Serviceable Obtainable Market (SOM): The Execution Proxy
SOM is the most critical metric for Series A and B rounds. It represents the revenue you can capture within 24–36 months using your current Operational Grip. It must be backed by your sales velocity and CAC constraints.
The Forensic Formula for SOM Realism:
SOM < (Current Sales Capacity X Quota Attainment%) X (Sales Cycle Length Factor)
Note: If your SOM requires $50M in revenue but your current GTM (Go-to-Market) engine only supports $5M in capacity, your SOM is a fiction.
Regional Calibration (SF vs. London vs. Toronto)
Market sizing is not a universal language; it has regional dialects.
San Francisco (The Aspirational Lens):
SF investors prioritize "Velocity-heavy" models. They want to see how a small SOM today creates an "Entry Point" into a massive "Adjacency TAM" tomorrow. They value Narrative Velocity. Your market slide in SF should focus on how you "eat" adjacent markets through network effects.
London & Toronto (The Audit Lens):
Investors in London and Toronto are "Unit Economic-heavy." They treat your market slide as a spreadsheet, not a vision board. They will scrutinize your Contribution Margin within the SOM.
London: Focuses on regulatory barriers. If your TAM includes the EU, you must show the cost of GDPR/MiFID II compliance.
Toronto: Highly focused on the "Efficiency Score." They want to see that your SOM capture doesn't rely on "Growth at all costs" but on a sustainable LTV/CAC ratio.
The Regional Forensic Formula (The Efficiency Score):
Efficiency Score= Net New ARR
Net Burn
In Toronto/London, this must be > 1.5 to validate your SOM capture strategy.
Three Technical DD Red Flags
Avoid these specific errors that trigger an immediate "No" from tier-1 analysts:
The "Fixed Pie" Fallacy: Assuming a market is static. If you are entering a mature market, your SOM must account for Incumbent Displacement Cost. You aren't just "getting" customers; you are "buying" them away from Oracle or SAP.
Blended CAC Ignorance: Calculating SOM without segmenting CAC. Capturing the first 1% of a market is cheap (Early Adopters). Capturing the next 4% is 3x more expensive. If your financial model assumes a flat CAC, your SOM logic is broken.
Gross vs. Net Confusion: This is the most common error in Fintech and Marketplace models. Your TAM is your Net Revenue Opportunity, not the Gross Merchandise Value (GMV) flowing through the system.
Three Earned Secrets (The Hidden Debt)
1. The "Hiring Friction" SOM Cap (US Specific):
In high-growth US tech hubs, your SOM is often capped by Recruitment Velocity, not customer demand. If your SOM requires scaling from 10 to 80 account executives in NYC, the local "Talent War" will inflate your Opex by 30% more than your model suggests. This "Hidden Talent Debt" effectively shrinks your obtainable market.
2. The SR&ED/SRED Illusion (Canada Specific):
Canadian founders often include SR&ED tax credits as "Effective Revenue" when discussing market viability. This is a mistake. Professional investors view SR&ED as a temporary subsidy that masks poor Metric Integrity. If your SAM only works because the government pays for 30% of your R&D, you don't have a market; you have a subsidized lab.
3. The "Localization Debt" (UK/Europe Specific):
Founders often claim the "European Market" is their SAM. There is no European Market. There are 27+ different regulatory, linguistic, and cultural silos. The cost of localizing a fintech product for Germany vs. France is a "Technical Debt" that most founders ignore. If you haven't budgeted for local compliance officers and translated UI/UX, your European SAM is essentially zero.
Forensic Unit Economics
To prove your SOM is achievable, you must show the math of the "Unit." An investor will back-calculate your market size using your LTV (Lifetime Value) logic.
The Forensic Formula for Unit Viability:
LTV = (ARPU X Gross Margin%) Monthly Churn%
If your LTV is less than 3x your CAC, your SOM is "Unfundable." You may have a large market, but you do not have a profitable way to reach it.
The Forensic Formula for Market Penetration Speed:
Time to SOM Capture = Target SOM Revenue
Avg. Deal Size X Sales Team Velocity
If this calculation results in a timeframe longer than your "Cash Runway," your market slide is a liquidation warning.
Expert FAQ: The Unasked 1% Questions
Q: How do I account for "Negative Churn" in my SAM?
A: "Negative Churn" (expansion revenue) effectively increases your SAM over time without requiring new customer acquisition. If your "Net Revenue Retention" (NRR) is >120%, you should present a "Layer Cake TAM" that shows how existing customers expand your addressable pool.
Q: Should I include "Unbooked Demand" in my SOM?
A: Only if it is backed by a "Letter of Intent" (LOI) or a "Proof of Concept" (POC). Otherwise, it's a "System 1" vanity metric. Elite founders separate "Qualified Pipeline" from "Theoretical SOM."
Q: How does "Operational Grip" affect valuation?
A: Operational Grip is the delta between your projections and your historical accuracy. If you promised $1M in SOM capture last year and hit $950k, your "Grip" is high. If you hit $500k, your current market projections will be ignored.
Forensic Audit Checklist
Before you hit "Send" on your deck, run these five checks:
Check 1: The Bottom-Up Test. Can you derive your SAM by multiplying a specific number of companies by a specific price point? (No percentages allowed).
Check 2: The Egress Test. Have you stripped out all non-captured revenue (GMV, pass-through costs, taxes) from your TAM?
Check 3: The Capacity Alignment. Does your SOM revenue target match the hiring plan in your "Use of Proceeds" slide?
Check 4: The Competitive Discount. Have you subtracted the market share of incumbents who have "Vendor Lock-in"?
Check 5: The Margin Guardrail. Is your Gross Margin >70%? If not, your TAM needs to be 2x larger to justify the same valuation.
The GTM Physics
Defining the market is only the "Static" phase of fundraising. The "Dynamic" phase—how you actually move through that market without burning your entire Series A in six months—is governed by GTM Physics. In our next sub-pillar, we will analyze why most "Product-Led Growth" (PLG) models are actually "Sales-Led" monsters in disguise, and how to spot the "LTV Decay" before it hits your cap table.
The Funding Blueprint Kit ($497) provides the exact Forensic Market Sizing calculators and Assertion-Led design frameworks used by the founders mentioned in our Trench Reports. It eliminates Cognitive Load for investors and ensures your Metric Integrity is beyond reproach. Visit the home page to secure your audit-ready templates.
Funding Blueprint
© 2026 Funding Blueprint. All Rights Reserved.