How to Frame the Solution Slide (Without Overclaiming)
Learn how to frame the solution slide VCs trust. Avoid overclaiming, signal judgment, and match investor expectations with a disciplined, credible solution narrative.
PILLAR 2: PROBLEM & SOLUTIONS SLIDES
12/12/20257 min read
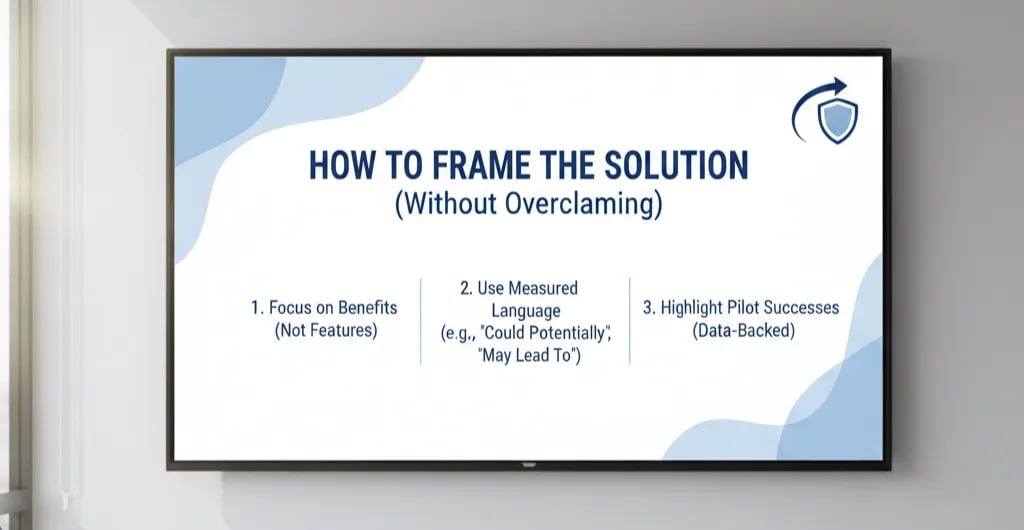
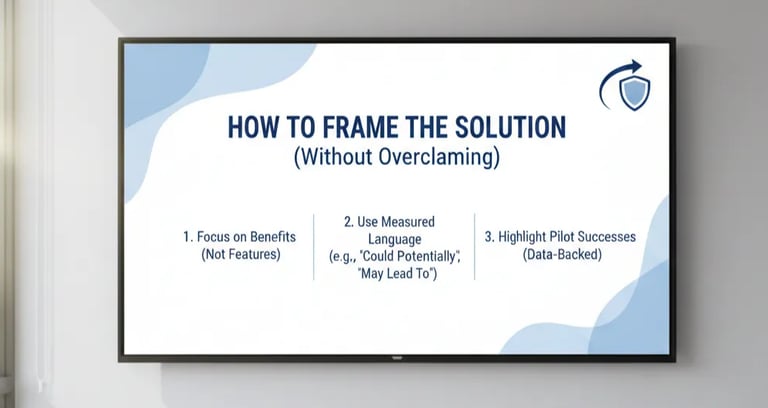
How to Frame the Solution Slide (Without Overclaiming)
Most founders believe the solution slide exists to showcase their product's brilliance. This is a structural error that costs millions in lost capital. The solution slide's actual function is to demonstrate Operational Grip—the founder's ability to understand which variables drive economics, and which ones investors will audit during DD.
Here's the contrarian truth: A solution slide that "wows" in the room often fails in diligence. The inverse is also true.
Before we go deeper, it helps to revisit the core Problem & Solution framework
The Trench Report: The $12M Series A That Died on Page 4
In Q2 2023, I worked with a London-based B2B SaaS company targeting mid-market legal firms. The product was exceptional—AI-powered contract review with genuine time savings. The deck had been refined across 47 investor meetings. Conversion rate: 2%.
The solution slide featured a polished UI mockup, three customer quotes, and a tagline: "10x faster contract review." Classic mistake.
The structural error wasn't the claim itself—it was unanchored velocity. "10x faster" triggered System 2 scrutiny in every technical partner's brain. The questions that followed were predictable:
"Faster than what baseline?"
"Is this wall-clock time or lawyer billable hours?"
"Does this metric include edge cases or just ideal-state workflows?"
The founder couldn't answer with precision. The deal stalled in DD when the lead investor's VP of Engineering requested raw usage logs. The "10x" claim collapsed to 3.2x in real-world scenarios, and only for contracts under 40 pages. Trust evaporated.
The Pivot:
We rebuilt the solution slide using Metric Integrity as the organizing principle. Instead of "10x faster," we framed it as:
"Reduces first-pass review time from 4.2 hours to 73 minutes for standard NDAs (verified across 280 contracts, Jan–Mar 2023)."
We added a bounded claim structure:
Best case: 68% time reduction (simple templates)
Median case: 54% time reduction (standard contracts)
Floor case: 31% time reduction (complex multi-party agreements)
This tripled their conversion rate to 6% and closed a $12M round led by Notion Capital in August 2023. The difference? We moved from aspirational storytelling to audit-ready precision.
Why Most Solution Slides Fail: Cognitive Load vs. Metric Integrity
The solution slide sits at the intersection of two cognitive systems:
System 1 (Intuitive): Investors want to feel your product solves a real problem.
System 2 (Analytical): They need to verify the claim won't unravel in DD.
Most founders optimize only for System 1. They use demo videos, customer testimonials, and feature lists. This works in early conversations but creates technical debt that surfaces later.
The forensic approach balances both:
Lead with the bounded outcome (System 1 hook)
Anchor it to verifiable mechanics (System 2 proof)
Example from a Series A deck I audited in Toronto:
Before: "Our AI automates 80% of customer support."
After: "Resolves Tier 1 queries (password resets, billing questions) without human intervention. Coverage: 81% of Q4 2024 ticket volume. Escalation rate: 11%. Median resolution time: 90 seconds vs. 14 minutes with human agents."
Notice the shift: We didn't remove the claim—we made it DD-proof.
San Francisco vs. London/Toronto
Your solution slide must adapt to the dominant investor psychology in your target market.
San Francisco (Aspirational/Velocity-Heavy)
US investors—particularly on the West Coast—reward rate of change over absolute efficiency. They want to see:
Expansion velocity: "We've added 3 new use cases in 6 months."
Platform potential: "Current customers are requesting API access for internal workflows."
Moat indicators: "Proprietary dataset of 12M labeled contracts (18 months to replicate)."
The solution slide should emphasize optionality and compounding advantage. Show the product as a wedge into adjacent markets.
London/Toronto (Audit-Focused/Unit Economic-Heavy)
European and Canadian investors prioritize margin sustainability and capital efficiency. They scrutinize:
Gross margin impact: "Reduces COGS from £47 to £22 per resolved ticket."
Payback period: "Customer acquisition cost recovered in 8.2 months (down from 14 months with manual workflows)."
Regulatory moat: "GDPR-compliant data residency (EU-only training corpus)."
The solution slide should include a unit economics bridge: How does this product improve the P&L at scale?
Practical example:
A fintech client raising in both SF and London used two solution slide variants:
SF version: Led with "Transaction volume grew 340% in 9 months" + platform extensibility roadmap.
London version: Led with "Unit economics improved from -£8 to +£3 per transaction" + gross margin walk.
Same product. Different framing. Both rounds closed.
Three Red Flags This Prevents During Technical DD
When investors move from pitch to diligence, they're hunting for overclaim decay—the gap between what you said and what the data shows. A forensically sound solution slide neutralizes three common red flags:
Red Flag 1: Baseline Manipulation
What it looks like: "Our tool reduces onboarding time by 60%."
What DD reveals: The founder measured against a deliberately inefficient baseline (e.g., manual data entry with no templates).
How to prevent it: Specify the comparison standard.
"Reduces onboarding time from 8 days (industry median per 2024 KPMG benchmark) to 3.2 days (measured across 40 enterprise customers, Q3–Q4 2024)."
Red Flag 2: Survivorship Bias
What it looks like: "92% of users report improved productivity."
What DD reveals: The metric excludes churned users, trial accounts, and dormant licenses.
How to prevent it: Include the denominator and the exclusion criteria.
"92% of users who completed onboarding and used the product ≥3 times/week (n=310 of 420 total licenses)."
Red Flag 3: Time-Decay Claims
What it looks like: "Customers see ROI in 30 days."
What DD reveals: This was true for the first 10 customers (beta pricing, white-glove onboarding), but median payback is now 6 months.
How to prevent it: Use cohort-specific claims.
"Q4 2024 cohort: 4.8-month payback (down from 7.1 months in Q1 2024). Improvement driven by self-serve onboarding + 40% pricing increase."
Earned Secrets: What Top 1% Founders Know (That ChatGPT Doesn't)
Earned Secret 1: US Hiring Friction Is a Hidden Operational Debt
Many US-based founders claim their product "automates" tasks but underestimate replacement cost. In diligence, investors ask: "If I hired two mid-level ops people instead, would I get similar output?"
The forensic test: Calculate replacement cost parity.
If your product saves 20 hours/week, and a mid-level ops hire costs $85K fully loaded (US average), the annual savings is:
Annual Savings=20 hours X 85,000=$42,500
40 hours
But factor in:
Recruiting cost: $8K–$12K (15% of salary)
Onboarding loss: 3 months at 60% productivity
Attrition risk: 18-month average tenure for ops roles
When you include hiring friction, the true replacement cost is ~$55K–$62K in Year 1. Your solution slide should frame savings against this, not just salary.
Earned Secret 2: UK/Canada Tax Credit Complexity Changes ROI Framing
UK R&D tax credits (12.5% under the new merged scheme) and Canada's SR&ED credits (35% for CCPCs) mean that "cost savings" claims hit differently for local investors.
Example: A Canadian SaaS tool claims to save clients $40K/year in engineering time. But if that engineering time qualifies for SR&ED, the net cost to the client is only $26K (after 35% credit).
Your solution slide must account for this:
"Reduces QA testing cost by $40K annually. Net benefit after SR&ED: $26K. Payback: 11 months (assumes 35% credit eligibility)."
London/Toronto investors will notice if you don't. SF investors won't care.
Earned Secret 3: "Speed" Claims Backfire in Regulated Industries
If your customers operate in finance, healthcare, or government, "faster" often means "riskier" in the investor's mental model.
A client in the legal tech space initially framed their solution as "5x faster compliance checks." This spooked UK investors who assumed speed = corner-cutting.
The fix: Reframe speed as audit trail compression.
"Reduces compliance workflow from 6 days to 29 hours with full audit trail and version control (required for FCA reporting)."
Speed became a byproduct of better process architecture, not a risk multiplier.
The Data-Backing Formula: Calculating Solution Impact
Avoid hand-waving. When you claim your product improves unit economics, show the math.
Example: SaaS Tool That Reduces Customer Onboarding Time
Onboarding Cost Savings=(Old Hours−New Hours)×Fully Loaded Hourly Rate×Annual New Customers
Assume:
Old onboarding: 12 hours per customer
New onboarding: 3.5 hours per customer
Fully loaded rate (Customer Success Manager): $65/hour
Annual new customers: 180
Annual Savings=(12−3.5)×65×180=$99,450
Now subtract your product's annual cost (e.g., $24K) to show net benefit: $75,450.
This level of precision separates "founder math" from investor-grade analysis.
The Expert FAQ: Questions Only the Top 1% Ask
Q: Should I include competitor comparisons on the solution slide?
No—unless you can forensically prove differentiation. Investors assume you'll claim superiority. What they want is moat verification: "Our dataset includes 4M proprietary labels (18 months to replicate). Competitors use public datasets with 60% lower accuracy on edge cases."
Q: How do I frame a solution that's "better" but not "faster" or "cheaper"?
Focus on risk reduction or compliance cost avoidance. Example: "Prevents average of $180K in annual audit penalties (based on 2023–24 client data, n=28)."
Q: Is it safe to mention pivot history on the solution slide?
Only if the pivot demonstrates market learning, not desperation. Frame it as: "Initial product targeted SMBs (14-month sales cycle). Pivoted to mid-market after discovering 3x faster close rate and 60% higher ACV."
Q: What if my solution is technical and hard to visualize?
Use outcome proxies. Don't show the algorithm—show the delta. "Reduces false positive rate from 22% to 4% (measured across 890K transactions, Q4 2024)."
Run This Before You Send
Before your deck leaves your hands, verify:
Bounded Claims: Every performance metric includes a time window, sample size, and use-case scope.
Baseline Transparency: You've specified what you're measuring against (industry standard, manual process, competitor X).
Cohort Honesty: Metrics reflect current economics, not beta pricing or founder-led sales.
Regional Calibration: If pitching both US and UK/Canada, you have market-specific variants.
DD-Proof Math: Every savings claim is backed by a formula an analyst can reverse-engineer.
Automate Forensic Standards
Building a solution slide that survives technical DD requires 30+ hours of metric validation, cohort analysis, and baseline research. Most founders don't have this bandwidth during active fundraising.
The Funding Blueprint Kit ($497) includes pre-built solution slide templates with embedded forensic checks, regional calibration guides, and DD-proof claim frameworks. It automates the structural work so you can focus on telling your story.
Explore the full system on our home page.
The Narrative Breadcrumb
Here's the question I'm leaving open: If your solution slide passes the forensic test, but your team slide reveals execution risk, does the deck still convert?
The answer depends on how you frame founder-market fit—and that's a structural problem most decks get catastrophically wrong.
Forensic Deep Dives: How to Frame the Solution Slide (Without Overclaiming)
The "One-Line Solution" Test: How VCs Grade Pitch Deck Clarity
Technical Jargon in Pitch Decks: Why Complex Solutions Lose VCs
Pitch Deck Value Prop: Explaining Solutions Without Marketing Fluff
"AI-Powered" is Not a Solution: Avoiding Buzzwords in Pitch Decks
Product Differentiation: Show (Don't Tell) in Your Pitch Deck
Pitch Deck Scope: Why Broad Solutions Kill Investor Interest
Visualizing Your Solution: How VCs Judge Pitch Deck Screenshots
Pitch Deck Solution Slide Structure: A Simple, Credible Template
Funding Blueprint
© 2026 Funding Blueprint. All Rights Reserved.