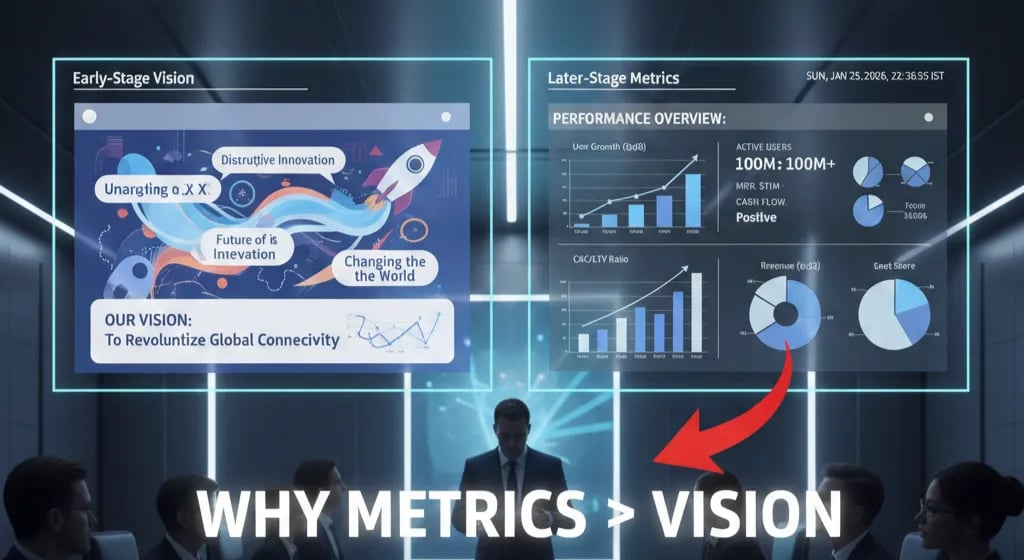
Why Later-Stage Decks Prioritize Metrics Over Vision
At Series B, 'Vision' is a liability. A forensic audit of the Growth Test: Why investors demand 'CAC Payback' and 'Cohort Layer Cakes' instead of stories.
1.4 HOW PITCH DECKS FIT INTO DIFFERENT FUNDRAISING STAGES?
1/25/20264 min read
Why Later-Stage Decks Prioritize Metrics Over Vision
If you are raising a Series A or B in 2026 and your deck opens with a "manifesto" on the future of humanity, you have already lost the term sheet. At the Seed stage, investors buy a dream. At Series A, they buy a machine. Continuing to pitch "vision" when you should be pitching "velocity" is the fastest way to signal you are an operational liability.
This creates a lethal disconnect. You believe you are painting a picture of a unicorn; the partner at Sequoia or Andreessen Horowitz sees a founder who doesn't know their own dashboard. This misalignment is why understanding How Pitch Decks Fit Into Different Fundraising Stages is not an aesthetic choice—it is a survival requirement.
The Forensic Diagnosis
When I audit a Series A deck and see five slides dedicated to "The Problem" and only one vague slide on "Traction," I don't see a visionary. I see a risk.
The "Red Flag" Scenario You show a graph with a hockey stick curve going up and to the right, labeled "Projected Revenue," but the Y-axis has no numbers, or worse, it is based on "Cumulative GMV" rather than Net Revenue. The VC immediately discounts your valuation by 50%. Why? Because you are hiding the health of the engine behind the noise of the exhaust. They assume your churn is high, your CAC is unsustainable, or your margins are nonexistent.
Psychological Audit Why do founders commit this suicide?
Founder Ego: You identify as an "inventor," not an "operator." Math feels boring; narratives feel heroic.
Fear of Churn: You know your retention numbers are weak (e.g., <80% NRR), so you obfuscate them with grand visions of "Total Addressable Market" (TAM).
Seed-Stage Hangover: You are using the same muscles that won you $2M to try and raise $15M. It is a category error.
The Mathematical Proof: Vision < Velocity
In the US, UK, and Canadian markets, Series A capital is "fuel," not "discovery money." The math is binary. Investors are not looking for if it works; they are calculating how fast it scales before the wheels fall off.
If you focus on narrative over numbers, you increase the investor's Cognitive Load. Every second they spend trying to calculate your burn multiple is a second they aren't thinking about writing a check.
The Logic Chain:
Seed Stage: Valuation = Team + Vision + Option Value. Risk = Product Market Fit (PMF).
Series A/B: Valuation = (ARR × Multiple) × Growth Rate. Risk = Go-To-Market (GTM) Efficiency.
The Shift: Once you have >$1M ARR, you are a measurable asset. A "vision" deck at this stage implies you are avoiding the audit.
The Hard Metrics: Consider two companies with $2M ARR.
Company A (Vision Deck): Talks about changing the world. Shows 200% YoY growth.
Company B (Metrics Deck): Shows 200% YoY growth, but proves a CAC Payback Period of 9 months and Net Dollar Retention (NDR) of 120%.
Company B gets the term sheet. Company A gets a "let's keep in touch." Company B proved the machine prints money; Company A just claimed it does.
The "Insider" Solution Protocol
You must strip the romance from your deck and replace it with forensic evidence of efficiency.
The Transformation Protocol:
The "Unit Economic Engine" Slide:
Weak Version: "We have strong unit economics and high LTV." (Trust me, bro).
VC-Ready Version: A bridge chart showing exactly how $1 of marketing spend converts into $4 of LTV over 24 months. State the inputs clearly: CPA, Sales Cycle Length, Onboarding Cost, Churn Rate, Expansion Revenue.
The Formula: Use the "Efficiency Score" equation directly in your deck to prove you are an outlier.
Rule of 40 (Classic): Growth Rate % + Profit Margin % > 40% Burn Multiple (Modern): Net Burn / Net New ARR < 1.5x
If your Burn Multiple is under 1.0x, bold it. It means you are capital efficient. If you are raising $10M, show exactly how that injection lowers the Burn Multiple over time due to economies of scale.
Cohort Analysis: Replace your cumulative revenue chart with a Layer Cake Chart (Revenue by Cohort). This is the single most validated signal of Product-Market Fit. If the older cohorts (bottom layers) are not shrinking, you have negative churn. This slide alone can justify a 2x valuation premium.
The "Death Traps"
Do not over-correct into an accountant's spreadsheet. Avoid these specific failures:
The "Blended CAC" Lie: Do not combine organic and paid traffic to lower your CAC. Sophisticated investors in London or Silicon Valley will strip out organic traffic immediately to see the true cost of scaling. If your Paid CAC is $500 but you report a Blended CAC of $50, you are committing diligence fraud.
Using 2021 Multiples: Do not project a valuation based on 50x ARR. The market in 2026 has normalized. Use comp sets from the last 12 months.
EBITDA Obsession: While efficiency is key, do not show you are profitable at the expense of growth if you are in a "Winner Take All" market. Series A investors want to see you can be profitable, not that you are hoarding cash and stalling capture.
The "High-Ticket" Conclusion
Transitioning your deck from "Vision" to "Metrics" is not an editing exercise; it is a valuation strategy. A founder who knows their LTV:CAC ratio down to the cent commands a premium because they reduce execution risk. Fixing this perception gap adds millions to your pre-money valuation.
For the complete architectural breakdown of a winning deck, read How VC Pitch Decks Really Work in 2026 — And Why Most Founders Get Them Wrong.
The Filter:
You can build these financial models and cohort analyses manually, or you can use "The AI Financial System" included in our $5k Consultant Replacement Kit ($497) available on the home page. It auto-generates the exact Unit Economics and Efficiency metrics investors demand, ensuring your numbers survive the diligence audit.
Funding Blueprint
© 2026 Funding Blueprint. All Rights Reserved.