Examples: Good vs Bad Problem & Solution Slides (VC Analysis)
Real VC-style analysis of good vs bad problem and solution slides—how investors judge clarity, credibility, and founder judgment in seconds.
PILLAR 2: PROBLEM & SOLUTIONS SLIDES
12/14/202511 min read
Good vs. Bad Problem & Solution Slides: A VC's Forensic Autopsy
Most founders believe a compelling problem slide requires emotional storytelling. They are wrong. It requires surgical proof.
The slides that kill raises aren't the ones with bad design. They're the ones where a partner can't answer a single question after reading them — not because the business is weak, but because the founder confused "relatable" with "credible." That confusion costs capital. In some cases, it costs companies.
Before we go deeper, it helps to revisit the core Problem & Solution framework
The Trench Report: The $14M Series A That Died on Slide 3
In Q3 2023, a London-based B2B SaaS founder — let's call them Meridian (name changed) — entered partner meetings at three tier-one funds with a deck that had been praised by two accelerators. Meridian was targeting a $14M Series A. The product had genuine PMF signals: 41 paying customers, 112% net revenue retention, and a CAC payback of 8 months.
The problem slide read: "Procurement teams waste countless hours on manual invoice reconciliation, leading to costly errors and compliance risks."
The solution slide showed a product screenshot with five feature callouts and a tagline: "AI-powered automation for modern finance teams."
They passed. All three.
The forensic error wasn't the copy. It was the structural sequence. The problem slide made a claim about "countless hours" with zero quantification. The solution slide answered a question the investor hadn't yet accepted as real. There was no causal bridge — no mechanism connecting the stated pain to the proposed fix to a dollar figure any GP could pressure-test.
The Pivot: We rebuilt slide 3 in a single working session. The problem slide was restructured around one number: "The average enterprise AP team processes 2,300 invoices per month. 18% require manual intervention. At a fully-loaded cost of £38/hour for a senior AP associate, that's £18,700/month in recoverable operational waste — per customer."
The solution slide was stripped to one sentence and one flow diagram: "Meridian auto-resolves 94% of exception invoices without human touch. Here's the exact mechanism."
Meridian closed a £11.2M round six weeks later — different lead, same deck structure. One fund that had previously passed re-engaged after seeing the revised materials shared by a mutual LP.
The problem wasn't the business. It was the Cognitive Load placed on a GP who had seen 40 decks that week.
Forensic Anatomy of a Problem Slide
A bad problem slide creates curiosity. A good one creates conviction.
There are four structural components every problem slide must carry to survive Technical Due Diligence. Most decks carry one, occasionally two.
1. Quantified Pain (not described pain) "Manual processes are inefficient" is a description. "Finance teams spend 23% of their working hours on reconciliation tasks that generate zero billable output" is a claim with audit potential. The difference is Metric Integrity — every number must be traceable to a source, an assumption, or a customer quote with a name attached.
2. The Villain Identification VCs are not buying a solution. They are shorting a problem. Your problem slide must name the structural reason the problem exists — not just that it exists. Is it a legacy vendor with captive contracts? A regulatory gap? A workflow locked into a 30-year-old ERP system? Without a named villain, there is no moat thesis. Without a moat thesis, there is no investment.
3. The Cost Stack This is where most decks collapse. The cost of the problem must be expressed at three levels: the individual user (time lost), the business (revenue impact or cost drag), and the market (TAM derivative). Forensic Formula where it matters:
Recoverable Waste per Customer=Monthly Exception Volume×Manual Hours per Exception×Fully-Loaded Hourly Cost
Current Resolution Rate
Run this calculation using your own customer data. Then present it on slide 3. That single number — sourced from real accounts — does more work than any narrative paragraph.
4. System 1 vs. System 2 Engagement System 1 thinking is the GP's pattern-matching gut: "I've seen this before — is it Stripe for X or Palantir for Y?" System 2 is deliberate, analytical processing — the mode required to evaluate unit economics and market structure. A bad problem slide forces System 2 engagement before System 1 has fired. The investor is doing algebra before they've accepted the premise. Good problem slides are designed to clear System 1 in under 8 seconds — one sharp claim, one provocative number — and then earn the right to engage System 2 on the solution slide.
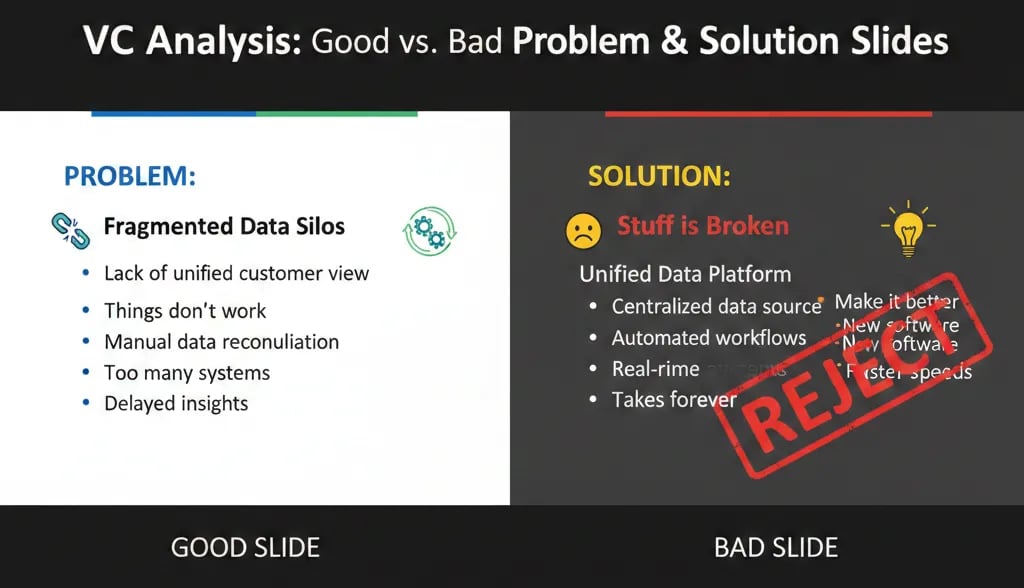
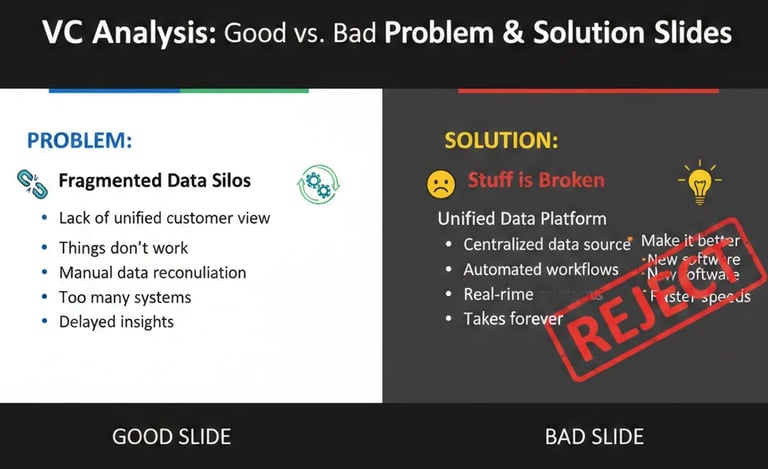
Forensic Breakdown: Good vs. Bad Side-by-Side
The Problem Slide
Opening Line
Bad: "Teams waste hours on manual tasks."
Good: "AP teams lose £18,700/month per entity to exception processing — before software."
Pain Quantification
Bad: Vague descriptors — "significant," "costly," "time-consuming" — with no source attached.
Good: Specific, customer-sourced figures with a methodology footnote and a named reference on request.
Villain
Bad: Absent entirely. The problem just exists, floating with no structural explanation.
Good: Named and precise — "Legacy ERP lock-in forces manual workarounds that no current vendor resolves at the exception layer."
Cognitive Load
Bad: Four bullets, two graphics, one stat, a sub-header, and a market size claim — all on one slide.
Good: One claim. One number. One villain. Full stop.
Investor Response It Generates
Bad: "Interesting — what's the market size?" The investor has moved past the problem without accepting it.
Good: "How are you calculating that £18K figure?" — They are already inside the model before the meeting has formally started.
The Solution Slide
Framing
Bad: A feature list — "AI-powered, real-time, scalable, configurable, enterprise-ready."
Good: A mechanism — "We sit between the ERP and the vendor portal and auto-resolve using three proprietary exception classifiers."
Visual
Bad: Product screenshots with five or more callouts, requiring the investor to interpret UI before understanding function.
Good: One flow diagram. Input → Process → Output → Metric. Nothing else on the slide.
Proof Point
Bad: "Trusted by 40+ customers" — a volume claim with no economic weight.
Good: "94% exception auto-resolution. 8-month CAC payback. Auditable in DD." Three numbers, all traceable.
Operational Grip Signal
Bad: Zero evidence that the team has encountered, and solved, a specific technical constraint.
Good: One sentence naming a constraint the team resolved — proving depth without a product demo.
Regional Calibration
The same slide deck should not be sent to a San Francisco fund and a London fund. This is not a stylistic preference — it is a structural requirement.
San Francisco (Aspirational / Velocity-Heavy)
Bay Area investors — particularly at Sequoia, a16z, and Benchmark — are trained to price optionality. They want to see that the problem is large enough to support a $1B+ outcome and that the solution architecture could expand into adjacent markets.
Problem slides in SF need to carry a vision anchor: a statement about what becomes possible once this problem is solved at scale. The solution slide should gesture at platform potential, even if current execution is narrow. SF funds are also significantly more tolerant of pre-revenue problem framing backed by strong founder credentials or prior exit history. They will sometimes fund the thesis before the traction.
Calibration instruction: Lead with market consequence. How big does this get if it works? Let the mechanism follow.
London / Toronto (Audit-Focused / Unit Economic-Heavy)
Investors at Balderton, Notion, Brighteye, or BDC Capital are running a different mental model. They are not pricing optionality — they are stress-testing defensibility. They want to see that the founder understands the unit economics of the problem itself, not just the solution. A London partner reading your problem slide is already asking: "What does this cost to resolve at 1,000 customers? At 10,000?" They are auditing Operational Grip before they have seen a single financial model.
In the UK, there is a secondary layer that SF investors rarely probe in early-stage decks: regulatory exposure. GDPR compliance in data-handling solutions, FCA registration requirements for fintech infrastructure plays, and employment law friction in HR-tech — all of these are treated as execution risks that need to be flagged, not buried.
Calibration instruction: Lead with the unit economics of the problem. Show that you have solved it profitably at small scale before asserting you can solve it at large scale. London investors will respect one honest constraint far more than three unqualified claims.
Three Red Flags This Prevents in Technical DD
Red Flag 1: The "So What" Flag When a problem slide fails to quantify pain in dollar or time terms, a DD analyst's first note is typically: "Market sizing appears top-down with no bottom-up validation." This triggers a deeper audit of all TAM claims. A forensic problem slide short-circuits this by providing the bottom-up logic before it is requested.
Red Flag 2: The "Mechanism Gap" Flag When a solution slide lists features rather than describing a mechanism, a technical reviewer cannot determine whether the product creates a structural advantage or is simply a UI wrapper on an existing API. This is the single most common reason enterprise-stage SaaS companies receive conditional term sheets pending a technical deep-dive — a process that adds 6–10 weeks to close and often results in price revision.
Red Flag 3: The "Founder Doesn't Understand the Business" Flag This is the most damaging flag in a DD process and the hardest to recover from. It is triggered when a GP asks, "Walk me through the economics of solving this problem for one customer," and the founder cannot do it without switching to a spreadsheet. A good problem slide — built on a real cost-stack calculation — means the founder has already done this work. The slide is evidence of operational fluency, not just storytelling.
What General Advice Doesn't Tell You
Secret 1 (US-Specific): The "Comp Trap" in Enterprise Problem Validation When US founders validate a B2B problem through customer discovery interviews, they routinely under-price the cost of the problem because enterprise buyers systematically underreport internal labour costs. The reason: in the US, fully-loaded employee costs — salary plus benefits plus payroll taxes plus equity dilution plus management overhead — typically run 1.25–1.4x base salary. But when an AP Manager tells you "it takes me two hours a week," they are quoting their base rate.
Your forensic cost calculation must apply the multiplier. A £60K salary AP associate in London costs the business approximately £84,000 fully-loaded. A $90K US equivalent runs $117,000–$126,000. If you are not applying this multiplier, your "cost of the problem" figure is understated by 25–40%. VCs who have built or operated businesses will catch this immediately.
Secret 2 (UK/Canada Tax Nuance): R&D Credits as a Proof Point, Not Just a Benefit UK founders building technical solutions can claim HMRC's SME R&D Tax Credit scheme — currently up to 33p in the £1 of qualifying R&D expenditure for loss-making SMEs (post-April 2023 RDEC reforms have compressed some rates, so verify current thresholds with a specialist). What most founders miss: a credible R&D credit claim filed alongside a pitch is a trust signal, not just a cash flow mechanism.
It tells a London or Toronto investor that the company has passed at least one external audit of its technical genuineness. Founders who reference their R&D claim in due diligence materials — with the accountant's name attached — reduce perceived technical risk. Founders who have never filed despite qualifying signal operational naivety.
Secret 3 (Hidden Operational Debt): The "Pilot Discount Trap" in Problem Validation Many B2B SaaS founders validate their solution with 3–5 pilot customers at 60–80% discounts, then use those pilots as "proof of problem." The red flag buried inside this: pilot customers have structurally lower switching costs than full-fee customers. Their willingness to use the product is not evidence of willingness to pay full price, and their success metrics are often inflated because pilots receive disproportionate founder attention.
A forensic investor will ask: "What does your resolution rate look like on customers who went through standard onboarding without founder involvement?" If you don't have that number, your solution slide's proof point is structurally compromised. The fix: tag your data by onboarding type before you enter a process.
Narrative Breadcrumb
Here is the question this analysis does not fully answer — and the one that separates decks that get a second meeting from decks that get a polite pass:
Once you have quantified the problem correctly and defined the mechanism precisely, how do you sequence those two slides relative to your traction slide without accidentally telling the investor the market is smaller than it is?
The answer involves a counter-intuitive placement decision that most pitch coaches get backwards. It is the difference between a deck that reads as a strong Series A and one that reads as a very impressive seed extension.
That sequencing framework is the subject of a follow-up analysis. If your raise is active, you may not have time to wait for it.
Expert FAQ: The Questions the Top 1% Know to Ask
Q: Should my problem slide cite third-party research or proprietary customer data?
A. Both — but in a specific hierarchy. Proprietary customer data with a company name or anonymised reference carries more weight than any Gartner or McKinsey citation, because it signals primary research capacity. Third-party research is used to establish market-level credibility, not to prove the problem exists in your specific customers. The sequence: state the problem, support with proprietary data, anchor to market research. Never lead with the research.
Q: How many problems should I solve on the problem slide?
A. One. Exactly one. Every additional problem you name on that slide statistically reduces the probability that an investor believes you have deep insight into any of them. If your product solves three distinct pain points, pick the one with the highest quantified cost and the clearest villain. The others belong in appendix slides labelled "Expansion Vectors" — not in the main sequence.
Q: What if my problem is genuinely hard to quantify?
A. Then you have a positioning problem, not a product problem. Every real business problem has a cost expression — it is either time, money, risk, or regulatory exposure. If you cannot express it in one of those four currencies, it typically means you are defining the problem at the wrong level of abstraction. Move down one layer and ask: "What does a specific person at a specific company do differently tomorrow if this problem doesn't exist?" The answer to that question is your quantification starting point.
Q: Can a strong solution slide rescue a weak problem slide?
A. No. The solution slide answers a question. If the problem slide did not successfully plant that question in the investor's mind as urgent and credible, the solution is answering something the investor hasn't bought. This is the structural equivalent of presenting a trial verdict before the prosecution has finished its opening argument.
Forensic Audit Checklist: Run This Before You Hit Send
Before submitting your deck to any fund, run this five-point check. If you cannot answer each item in under 30 seconds, the slide is not ready.
The One-Number Test: Does your problem slide contain one specific, source-attributable number that quantifies the cost of the problem in pounds, dollars, or hours? If the answer is "we have a few stats," the answer is no.
The Villain Test: Can you name — in one sentence on the slide itself — the structural reason this problem has not been solved already? Not "the market has been slow to adopt" — an actual structural barrier: incumbent lock-in, regulatory ambiguity, or a specific technical limitation.
The Mechanism Test: Does your solution slide describe how the product produces its outcome, or does it describe what the product does? Feature lists describe what. Mechanisms describe how. Investors fund mechanisms.
The System 1 Clearance Test: Show your problem slide to someone who has never heard of your company. Ask them to read it for 8 seconds and then close the laptop. Ask: "What problem are they solving and who loses money if it isn't solved?" If they cannot answer both parts, the slide has failed.
The Regional Fit Test: If your primary target fund is in London or Toronto, does your solution slide contain at least one unit economic proof point traceable to real customer data? If it does not, you are pitching an SF narrative to an audit-focused investor. The deck will not survive first-pass screening.
A Note on Automation
Building these forensic standards by hand — sourcing the right numbers, structuring the cost-stack calculation, calibrating the narrative sequence for regional investor preference — takes experienced operators multiple iterations and a significant amount of expensive advisory time.
The $497 Funding Blueprint Kit was built specifically to automate this forensic layer. It encodes the audit logic described in this analysis into a structured framework that generates investor-ready problem and solution slide structures based on your specific business model, target geography, and stage. Founders using it have consistently reduced their deck revision cycles from 6–8 rounds to 2–3. It is available through the home page — no upsell, no retainer required.
The deal that closes isn't always the strongest business in the room. It is consistently the one whose problem slide made a GP feel like they already understood the cost of inaction before the meeting started.
Forensic Deep Dives: Examples: Good vs Bad Problem & Solution Slides (VC Analysis)
Too Broad Solutions: A VC Breakdown of Bad Pitch Deck Examples
Weak Pitch Deck Framing: Examples of Poorly Positioned Problems
Pitch Deck Teardown: Great Problem Slides Ruined by Bad Solutions
Pitch Deck Narrative Fit: Examples of Perfect Problem-Solution Alignment
Investor Distrust: Pitch Deck Examples of Poor Startup Evidence
High Trust Signals: Examples of Perfect Pitch Deck Simplicity
Perfect Stage Fit: Pitch Deck Examples for Pre-Seed to Series A
The VC Pitch Deck Framework: How Investors Judge Problem & Solution
Funding Blueprint
© 2026 Funding Blueprint. All Rights Reserved.