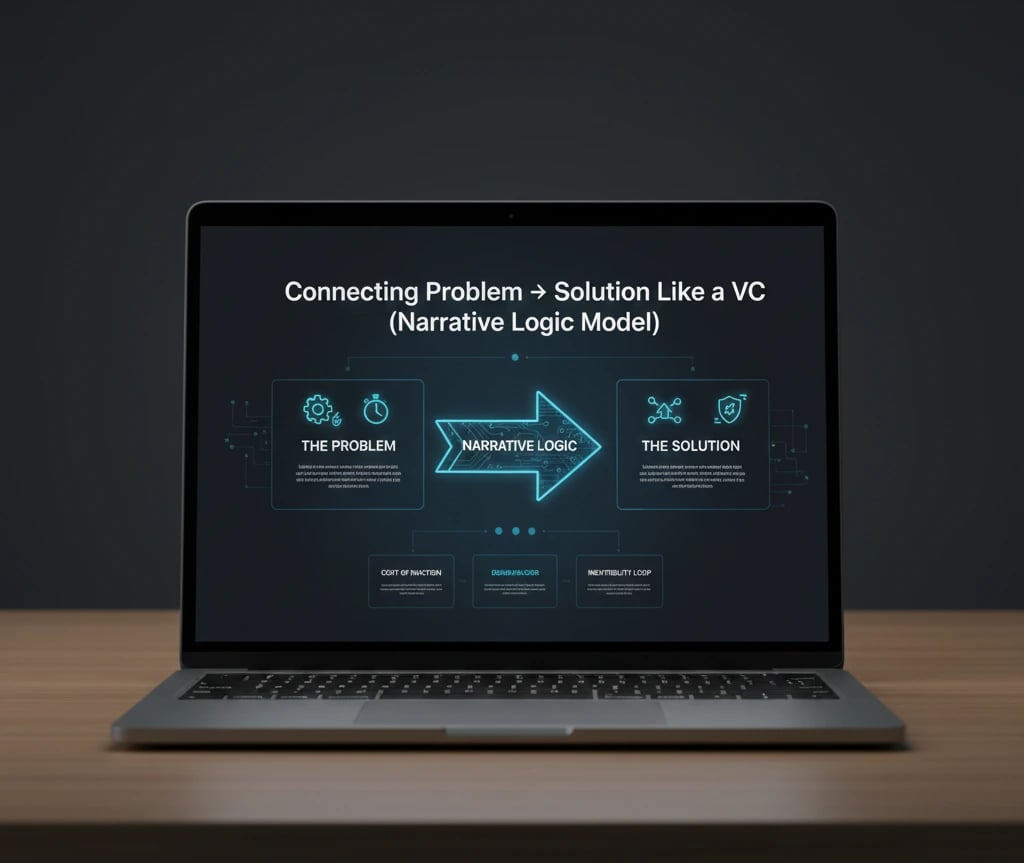
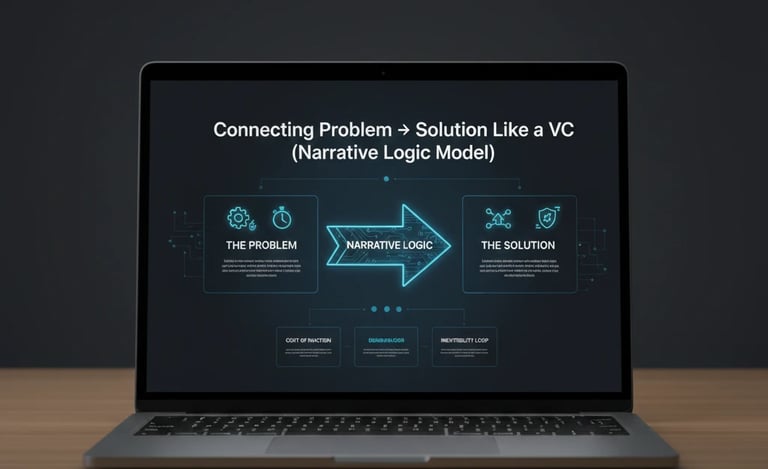
Connecting Problem → Solution Like a VC (Narrative Logic Model)
Learn how VCs evaluate whether your problem and solution actually connect—and why broken narrative logic kills credibility instantly.
PILLAR 2: PROBLEM & SOLUTIONS SLIDES
12/13/202512 min read
Connecting Problem → Solution Like a VC (Narrative Logic Model)
Your pitch narrative is not a story. It is a proof structure. And most founders are failing the proof.
Storytelling Is a Myth. Causal Logic Is the Game.
Founders are told to "tell a compelling story." That advice is costing them seven-figure term sheets.
A General Partner at a top-tier fund is not reading your deck as a narrative. They are running it as a falsifiability test. The question behind every slide is not "is this interesting?" — it is "does this claim necessarily lead to the next one?" If the answer is no at any point in the chain, the deck dies. Quietly. Without feedback.
The founders who closed rounds in 2024–2025 did not have better stories. They had better logical architecture. They built what I call a Narrative Logic Model (NLM): a causal chain where Problem → Evidence → Solution → Mechanism → Market → Model connects with the structural integrity of load-bearing joints — not rhetorical glue.
This post is the blueprint for building that chain. Surgically. With the math that backs it.
Before we go deeper, it helps to revisit the core Problem & Solution framework
The Trench Report: The £11.4M Series A That Collapsed in Week Three of DD
A specific deal. Dry language. Real consequences.
In Q3 2022, I was engaged as a fundraising advisor for a London-based B2B SaaS company operating in workforce compliance — specifically, IR35 contractor classification for mid-market UK enterprises. The founding team was technically excellent. The product had real traction: 34 paying clients, £1.2M ARR, and a 91% gross retention rate.
The lead investor — a prominent London-based fund with a heritage portfolio in RegTech — had issued a verbal commitment at £11.4M. Partner-level enthusiasm. IC memo drafted.
The deal collapsed in week three of technical due diligence.
The cause was not the product, the team, or the numbers. It was a structural fracture in the Narrative Logic Model that only became visible under forensic pressure.
The founding deck framed the problem as: "IR35 compliance is complex and risky for enterprises." The solution was framed as: "Our software automates the classification process."
On the surface: coherent. Under DD: fatally incomplete.
The due diligence team identified what I now call a causal gap — a missing logical node between problem and solution. The deck never established why existing solutions (there were four direct competitors) failed to solve the complexity. It asserted uniqueness without mechanistic proof. When the IC pressed the founder in the partner meeting on the specific failure mode of competitor products, she could not answer with precision. She spoke in category-level generalities.
The IC voted no. Not because she didn't know her product. Because her narrative did not prove she understood the problem at root-cause depth.
The Pivot That Recovered the Deal (With a Different Fund)
Four weeks later, after a forensic rebuild of the NLM, we re-ran the process with a second fund. The structural fix was specific: we inserted a single slide — which I call the Mechanism of Failure slide — positioned between the Problem and the Solution.
This slide did one thing: it documented, with client-sourced data, the exact point in the existing workflow where competitor tools broke down. Not category-level. Node-level. Specifically: competitor tools flagged classification decisions but left the legal liability with the client's HR department — creating a liability overhang that compliance officers refused to accept. Our client's product absorbed that liability through indemnification-backed decisions.
The causal chain now read: Problem → Root Cause → Mechanism of Failure in Existing Solutions → Why Our Architecture Solves at Root Level → Solution.
The second fund closed at £10.8M. Twelve weeks after the first deal died.
One missing logical node. £11.4M on the table. That is what narrative debt costs.
Building the Narrative Logic Model With Forensic Standards
The NLM is not a framework. It is a cognitive pressure test.
Every node in your narrative chain must survive two separate cognitive tests, which correspond to distinct investor mental states:
System 1 Thinking is the GP's fast-pattern brain. It operates in the first 11 seconds of slide contact. It is asking: "Does this feel structurally sound?" It detects logical gaps the way a structural engineer detects a sagging roofline — before the calculations are run. If your Problem → Solution connection requires the investor to mentally fill in missing steps, System 1 flags it as weak. The deck moves to the bottom of the pile.
System 2 Thinking is the DD analyst's deliberate, sequential reasoning brain. It operates in the partner meeting and during diligence. It is asking: "Can I falsify any claim in this chain?" This is where narrative debt becomes financially fatal. Every assertion that lacks a mechanism, a counter-argument addressed, or a metric anchor is a vulnerability.
Operational Grip is the quality you are demonstrating when your NLM is airtight. It signals to investors that you understand your business at a systems level — not just a product level. Founders with Operational Grip can answer the second-order question. Not just "what is the problem?" but "why has this problem persisted despite X, Y, and Z prior attempts to solve it?"
Metric Integrity is what separates a claim from a proof. Every node in the NLM must be anchored to a number that the investor can interrogate. Not a vanity metric. A causal metric — one that is structurally connected to the business model.
Cognitive Load is your enemy. The longer the investor must hold competing, unresolved ideas in working memory to understand your chain, the higher the probability of a no. The NLM's purpose is to reduce Cognitive Load to near zero. Each slide should resolve one question and create exactly one new one — the one you answer on the next slide.
The One Formula That Matters Most in the NLM
Most founders embed unit economics as a standalone financial slide. That is incorrect positioning. Unit economics are proof nodes in the narrative chain — they validate that the solution produces structurally sound commercial outcomes.
The single most interrogated formula in a B2B SaaS DD process is the CAC Payback Period. Not LTV:CAC ratio. Payback period. Here is why: in a high-rate environment, investors are not optimizing for theoretical lifetime value. They are auditing cash efficiency. How long is your capital exposed before a customer pays it back?
CAC Payback (months)= CAC
ARPU×Gross Margin %
If your CAC is £8,400, your ARPU is £700/month, and your gross margin is 74%, your payback period is:
8,400 =8,400 ≈16.2 months
700×0.74 518
16 months is acceptable in enterprise SaaS. Below 12 is strong. Above 24 is a structural problem that no narrative can paper over.
Position this number inside your solution slide — not in your financials appendix. It proves that your solution mechanism produces commercially efficient outcomes. That is a narrative function, not just a financial one.
San Francisco vs. London/Toronto
The same NLM pitched identically to SF and London will close one room and lose the other.
This is not a stylistic preference. It is a structural difference in what each investor cohort uses to validate the Problem → Solution connection.
San Francisco (Aspirational / Velocity-Heavy)
SF-based investors — particularly at pre-Series A — are making a bet on category creation speed. They want to see a Problem framed at macro scale, even if current traction is narrow. The NLM should front-load market pull evidence: inbound waitlists, viral coefficients, logo velocity. The Solution node should emphasize architectural moat — why your technical approach will be difficult to replicate at speed as the category scales.
In SF, the Mechanism of Failure slide I described above would typically be replaced with a Category Timing slide — one that argues why now using regulatory, technological, or behavioral shift data. The investor is asking: "Is this the right moment to back this thesis?"
Quantify velocity where possible. A formula that lands well in SF partner meetings: Logo Velocity Rate = New Logos Acquired in Last Quarter ÷ Total Logos 12 Months Prior. A rate above 40% signals category momentum.
London / Toronto (Audit-Focused / Unit Economic-Heavy)
London and Toronto investors — particularly at Balderton, Notion, OMERS, or MaRS-affiliated funds — are running a fundamentally different verification process. They are not betting on category creation. They are auditing capital efficiency and regulatory durability.
Your NLM must front-load the Problem with specificity of pain and cost of inaction — ideally expressed in a monetary figure your target customer already tracks. "Mid-market UK firms misclassify an average of 14% of their contractor base, creating a median IR35 liability of £340K per audit cycle" is a Problem statement that passes a London IC. "Compliance is complex and costly for enterprises" does not.
In London, the Solution node must explicitly address regulatory shelf-life. UK and Canadian investors have been burned by products whose commercial model was structurally dependent on a specific regulatory interpretation that subsequently shifted. Your solution slide must answer — without being asked — "what happens to this product if the regulation changes?"
Toronto-specific note: SR&ED (Scientific Research and Experimental Development) tax credit eligibility is frequently misrepresented in Canadian startup financials. If your COGS or R&D cost structure benefits from SR&ED refunds, investors in Toronto will audit whether those credits are claimed on a traditional or proxy basis, and whether your gross margin figures are presented pre- or post-credit recovery. Founders who cannot answer this in the partner meeting with precision are flagged for Metric Integrity failures.
Three Red Flags This NLM Prevents in Technical DD
These are not hypothetical risks. They are the three most common reasons funded deals re-price or collapse post-term sheet.
Red Flag 1: The "So What" Gap
This occurs when a founder can prove the problem exists but cannot prove that their specific solution architecture is the response to the specific failure mode. DD analysts call this the "So What" gap — the investor understands the problem and likes the product, but cannot construct a logical argument for why this product wins versus a well-funded competitor entering the space. The NLM's Mechanism of Failure slide closes this gap before it opens.
Red Flag 2: Metric Drift
This occurs when the metrics cited in the deck do not match the metrics extractable from the CRM, billing system, or cohort data during DD. The most common version: ARR figures calculated on a committed contract basis in the narrative, but on a cash-receipts basis in the financials. The delta triggers an integrity flag that rarely recovers. The NLM enforces a single metric definition per claim — stated explicitly in the slide footnotes.
Red Flag 3: Market Size Circularity
This occurs when the TAM is calculated by multiplying a unit price by a population figure with no structural argument for capture rate. Investors have seen this 4,000 times. It signals that the founder has not thought rigorously about the mechanism of market penetration — which is the same analytical muscle required to build a tight Problem → Solution chain. One failure predicts the other. The NLM forces founders to derive market size from the same causal logic used to frame the problem — eliminating circular construction.
Three Things the Top 1% of Founders Know
These do not appear in pitch deck guides. They come from deal rooms.
Earned Secret 1: US Hiring Friction as Hidden Operational Debt (SF-Specific)
When US-based founders project headcount to justify their use of proceeds, they routinely underestimate employer-side payroll burden in high-cost states. In California, the fully-loaded cost of a $160K base salary engineer includes: employer FICA (7.65%), California UI (up to 6.2% on the first $7,000), SDI (0.9%), workers' comp (variable, typically 0.8–1.5% for tech roles), and benefits (healthcare + 401K match typically adds $18–24K annually). The fully-loaded annual cost of that hire is frequently $205–215K — not $160K.
Investors who run their own bottoms-up headcount model during DD will identify this gap immediately. A founder whose "use of proceeds" slide implies $160K fully-loaded costs is telling an experienced investor they have not operated at scale before. Price your headcount correctly in the NLM's financial node.
Earned Secret 2: UK EIS/SEIS Eligibility as a Narrative Weapon (London-Specific)
Most early-stage UK founders treat SEIS/EIS eligibility as a back-office tax matter. The top 1% use it as a closing mechanism in the investor narrative. SEIS offers UK individual investors 50% income tax relief on investments up to £200K; EIS offers 30% relief up to £1M. For a London-based angel or small fund LP investing personally, the effective downside on a £200K SEIS investment is reduced to £100K before the business produces a single pound of return.
This changes the risk calculus structurally — not marginally. Founders who explicitly quantify this in their pitch materials (one slide, positioned after the investment ask) report measurably shorter close cycles with UK-based angels and family offices. The majority of founders do not do this because they treat it as a legal footnote rather than a narrative proof point. It is the latter.
Earned Secret 3: The Hidden Cost of UK Contractor-to-Employee Conversion
Post-IR35 reform, many UK scale-ups that built their early teams on contractor arrangements are carrying undisclosed operational debt: the retrospective NIC liability risk on contractors who were, in substance, employees. HMRC's CEST tool has a known accuracy gap — it produces "undetermined" results for approximately 20% of typical startup contractor profiles. If your team was built on contractor arrangements and you have not run a retrospective employment status audit, a competent London DD team will find it. The remediation cost — back-dated employer NICs plus potential penalties — can reach 20–25% of total contractor payments over the exposure period. This is a balance sheet risk that re-prices deals. Audit before you pitch.
The Narrative Breadcrumb
There is one component of the Narrative Logic Model not covered in this post — deliberately.
It is the Objection Architecture: the structural technique for pre-embedding the investor's most likely counter-argument inside your solution slide, and resolving it before they can raise it. When executed correctly, it does not just neutralise the objection — it signals a level of Operational Grip that most founding teams never demonstrate in a first meeting.
Founders who have seen this technique applied report that the partner meeting dynamic shifts from interrogation to collaboration. The mechanics are not intuitive. And they are different for technical versus commercial objections.
That is a different post. Or a different conversation.
Expert FAQ: Questions Only the Top 1% Know to Ask
Q: Should the Problem slide lead with qualitative pain or quantitative market evidence?
Neither, in isolation. The highest-performing Problem slides open with a specific, named instance of the problem — a case example, a regulatory ruling, a client quote with a monetary figure attached — and then zoom out to market evidence. This architecture activates System 1 recognition before System 2 scrutiny begins. It is sequencing, not just content.
Q: How do I handle it when the problem is well-known but the existing solutions are "good enough" for most of the market?
This is the most underrated structural challenge in B2B SaaS narratives. The answer is not to argue that existing solutions are bad. It is to argue that they are optimized for a prior constraint that no longer holds — a regulatory change, a cost curve shift, a workflow change driven by a macro trend. You are not replacing a bad solution. You are arguing that the solution environment has changed and the incumbent is structurally unable to adapt. That is a much stronger logical claim.
Q: At what round does the NLM's level of forensic rigor become mandatory?
System 1 scrutiny applies from the first email. System 2 scrutiny intensifies at Series A and becomes legally material at Series B, where representations in the deck can carry warranty implications in the investment agreement. Pre-seed founders should build NLM discipline early — not because investors will run full DD, but because the discipline of building it correctly exposes strategic weaknesses that are cheaper to fix at pre-seed than post-product.
Run This Before You Hit Send
This is not a polish checklist. It is a structural integrity test.
1. The Causal Chain Test. Read only your Problem, Mechanism of Failure, and Solution slides in sequence. Without reading anything else, can a stranger construct a precise argument for why your solution is the necessary response to this specific failure mode? If no: the chain is broken.
2. The Metric Anchor Test. Identify every claim in your narrative that uses a comparative word: "faster," "cheaper," "more accurate," "higher retention." Confirm that every one of these claims has a specific, source-cited number attached. Remove any that do not. Claims without anchors are liabilities in DD, not assets.
3. The Competitor Acknowledgement Test. Identify the strongest existing solution in your space. Confirm that your deck explicitly names it and argues — with mechanism-level specificity — why it fails at the root cause of the problem. If your deck pretends competitors do not exist or dismisses them in a 2x2 matrix, a competent investor will draw the conclusion that you do not understand them.
4. The Regional Calibration Test. Confirm you know the primary fund mandate of every investor on your list before sending. If they are SF-based velocity investors, your market sizing methodology should emphasize category creation and growth rate. If they are London/Toronto audit-focused funds, your financial slides must show CAC Payback Period, gross margin by cohort, and — where applicable — regulatory durability argument. One deck version does not serve both audiences.
5. The Metric Consistency Test. Extract your ARR, gross margin, and CAC figures from three separate locations in your deck. Confirm they are calculated on an identical basis in each instance. Discrepancies of even 2–3% between slide 4 and the appendix trigger Metric Integrity flags that are disproportionately damaging to investor trust.
The five-point checklist above takes most founding teams between four and eleven hours to run manually — and that assumes they know what they are looking for at each node.
The $497 Funding Blueprint Kit was built to automate this forensic standard. It embeds the NLM architecture, the regional calibration filters, the Metric Integrity checks, and the Objection Architecture framework into a structured system that producing a DD-ready narrative in a fraction of the time. Every formula, every slide structure, every checklist item in this post is operationalised inside it.
It is not a template. It is a forensic system.
Find it on the home page.
This post is one node in a structured content system on institutional-grade fundraising mechanics. Each post in the series builds on the causal logic of the last — by design.
Forensic Deep Dives: Connecting Problem → Solution Like a VC (Narrative Logic Model)
Pitch Deck Narrative Flow: Why VCs Demand Problem-Solution Congruence
The 2-Slide Pitch Deck Logic Test: Connecting Problem and Solution
Problem-Solution Fit: How to Avoid the #1 Pitch Deck Disconnect
The Missing Middle: Bridging the Gap Between Pitch Deck Problem & Solution
Solving Real Market Pain: The Pitch Deck Pattern VCs Look For
Pitch Deck Solution Simplicity: Why VCs Prefer Uncomplicated Products
Visualizing Problem-Solution Alignment: Pitch Decks Without Text Walls
Pitch Deck Visual Mapping: Linking Problem, Root Cause, and Solution
Why Pitch Decks Fail: Great Problem Slides Ruined by Weak Solutions
The 7-Second VC Pitch Deck Scan: Testing Your Narrative Congruence
Funding Blueprint
© 2026 Funding Blueprint. All Rights Reserved.