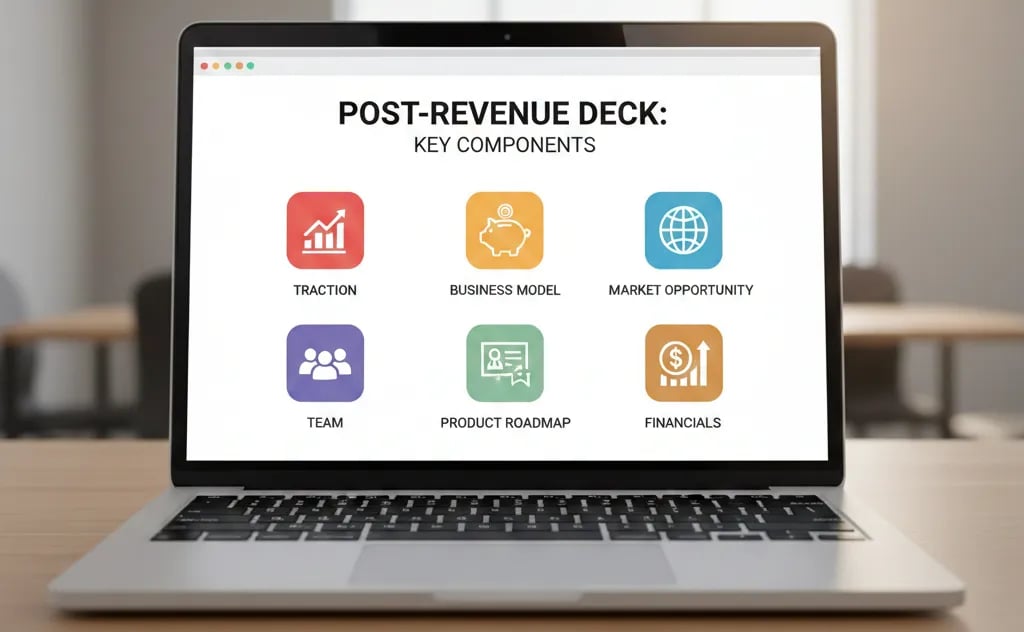
What to Include in a Post-Revenue Deck
Small revenue is more dangerous than no revenue. A forensic audit of the Post-Revenue Deck: Why 'Cumulative Growth' is a red flag and how to use 'Net Dollar Retention' to prove velocity.
1.4 HOW PITCH DECKS FIT INTO DIFFERENT FUNDRAISING STAGES?
1/25/20264 min read
Revenue Reveals Your Flaws
Reaching $1M ARR doesn't secure your Series A; often, it exposes why you shouldn’t be funded. In the Pre-Seed stage, you sold a dream. In the Post-Revenue stage, you are selling a machine, and we are looking for friction in the gears. If your revenue grows but your burn multiple explodes, you haven't built a business; you’ve built a cash incinerator.
Most founders treat their Series A deck like a Seed deck with a revenue chart slapped on the end. This is a fatal structural error. As outlined in How Pitch Decks Fit Into Different Fundraising Stages, the architectural requirements shift aggressively once you take a dollar from a customer. At this stage, ambiguity is not "potential." Ambiguity is risk. If you cannot mathematically prove your engine is efficient, the capital markets will starve you.
Why "Up and to the Right" Gets You Rejected
We see thousands of decks featuring the obligatory "hockey stick" revenue chart. Founders assume this visual validates product-market fit. To a forensic auditor or a Series A partner, a smooth, steep revenue curve without context is a massive red flag.
The "Red Flag" Scenario
You present a slide showing Top-Line Revenue growing 20% MoM. You omit the Gross Margin line, the CAC (Customer Acquisition Cost) evolution, and the Churn rate. The VC Thought Process: "They are hiding something. They are likely buying this revenue with unsustainable ad spend, or their churn is so high they have to refill the bucket aggressively every month. This isn't a growth company; it's a leaky bucket."
Psychological Audit
Why do founders commit this error?
Vanity Validation: You believe "Total Revenue" is the scorecard. It isn't. "Free Cash Flow Potential" is the scorecard.
Fear of Churn: You know your retention is weak (e.g., < 80% NRR), so you aggregate the numbers to mask the leaks.
The "VCs take risks" Fallacy: You mistakenly believe Series A investors are there to take product risks. We aren't. We are there to pour gasoline on a fire that is already burning efficiently.
The Cost of Inefficiency
In 2026, capital efficiency is the primary determinant of valuation. We don't just look at growth; we look at the cost of that growth.
If your deck lacks granular unit economics, you force the analyst to build a shadow model based on assumptions. When an analyst guesses, they guess conservatively. This automatically slashes your valuation.
The Logic of the Down-Round:
Assumption: You claim $2M ARR.
The Gap: You fail to disclose a CAC Payback Period.
The Math: If your CAC Payback is 18 months, but your average customer churns in 14 months, your LTV:CAC ratio is negative.
The Result: Every new customer you sign destroys enterprise value. Scaling this model accelerates bankruptcy.
The Cognitive Load Cost: If I have to search for your Net Dollar Retention (NDR) or calculate your Burn Multiple myself, you have added friction to the deal.
Open Deck.
See Revenue.
Search for Retention. (Not found).
Conclusion: The founder doesn't know their own metrics. Pass.
The "Insider" Solution Protocol: The Data Confidence Layout
Your Post-Revenue deck must transition from "Visionary Storytelling" to "Evidence-Based Execution." You need a dedicated "Metrics & Unit Economics" section that sits immediately after your Solution and Traction slides.
The Framework: The "Series A Health Check"
Do not clutter the slide. Present these four metrics clearly. If they are good, bold them. If they are bad, explain the strategy to fix them.
Net Dollar Retention (NDR): Must be >100% for SaaS. This proves your product becomes more valuable to customers over time (upsell/expansion).
CAC Payback Period: Ideally < 12 months. This proves capital efficiency.
LTV:CAC Ratio: Target 3:1 or higher. This proves long-term profitability.
Burn Multiple: (Net Burn / Net New ARR). If this is under 1.5, you are efficient. If it is over 2.0, you are burning too much to grow.
Before vs. After Comparison
The Weak Version (Retail Investor Style):
Header: "Financial Projections."
Content: A generic Excel graph showing revenue hitting $50M in 5 years.
Metric: "Cumulative Users" (A vanity metric that never goes down).
Vibe: Speculative, naive, untrustworthy.
The VC-Ready Version (Institutional Grade):
Header: "Unit Economics & Scalability."
Content: A Cohort Analysis (The "Layer Cake" chart) showing revenue retention by vintage.
Metrics: "NDR: 115%," "CAC Payback: 9 Months," "Gross Margin: 82%."
Vibe: Clinical, operational, investable.
The Equation to Highlight
If your metrics are elite, explicitly state your efficiency formula on the slide:
"Current Burn Multiple of 1.2x means for every $1.20 burned, we generate $1.00 of perpetual recurring revenue."
This signals to the investor that you treat their capital as a tool, not a runway.
The "Death Traps"
When fixing your deck, avoid these lethal over-corrections:
The "Adjusted EBITDA" Charade: Do not invent your own profitability metrics (e.g., "EBITDA excluding founder salaries"). We will catch this immediately during due diligence, and it looks dishonest. Use GAAP or standard SaaS metrics only.
Mixing Business Models: If you have SaaS revenue and one-off Service revenue, separate them. Combining high-margin software revenue with low-margin service revenue dilutes your multiple. A $1M ARR SaaS company is worth 10x more than a $1M Service agency.
Ignoring the "Dip": If you had a bad quarter, annotate it. "Q3 dip due to restructuring sales team—Q4 rebounded to 20% growth." If you hide the dip in a cumulative chart, you look deceptive.
The "High-Ticket" Conclusion
A post-revenue deck is an audit of your operational competency. A narrative gets you a meeting; clean unit economics get you a Term Sheet. By presenting a "Glass Box" business—where every metric is visible and verified—you de-risk the investment. In the current market, de-risking the asset is the fastest way to add $1M+ to your pre-money valuation.
For a complete breakdown of how to structure the entire narrative around these metrics, review the master system in How VC Pitch Decks Really Work in 2026 — And Why Most Founders Get Them Wrong.
The Filter Plug
You can spend weeks modeling these metrics in Excel and guessing the layout, or you can use the AI Financial System included in our $5k Consultant Replacement Kit ($497) available on the home page. It automatically formats your unit economics into the specific "Layer Cake" and "Burn Multiple" visualizations that Series A investors require.
Funding Blueprint
© 2026 Funding Blueprint. All Rights Reserved.