Why VCs Rarely Read Decks Fully (And What They Look For Instead)
Your deck isn't a brochure; it's a "Crime Scene." VCs don't read; they perform a 140-second "Autopsy." A forensic audit on the "Novelist's Fallacy" that kills your fundraise.
1.2: HOW INVESTORS USE PITCH DECKS INTERNALLY
1/19/20265 min read
If you are a Seed or Series A founder spending weeks perfecting the "narrative arc" of your 20-slide deck, you are actively sabotaging your own fundraise.
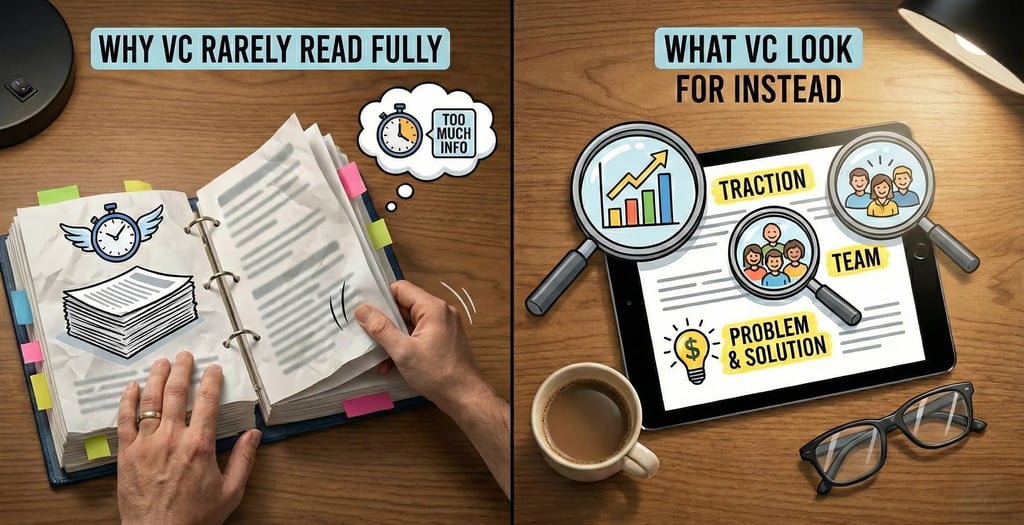
The lethal truth of 2026 is that Venture Capitalists do not read pitch decks; we autopsy them. The average partner spends less than 140 seconds on a first pass. If your value proposition requires a "build-up," you have already lost the room. This reality is foundational to How Investors Use Pitch Decks Internally, yet most founders ignore it. You believe you are telling a story; I believe I am scanning for reasons to say "no" so I can get back to my portfolio companies. Your deck is not a brochure; it is a crime scene where the evidence of your incompetence is usually hidden in plain sight.
The Forensic Diagnosis
The single most destructive error founders make is the "Novelist’s Fallacy." This is the mistaken belief that a VC will patiently wade through six slides of "The Problem" and "The Journey" to arrive at the solution.
The "Red Flag" Scenario
Here is what I see in 90% of passed-on decks:
Slide 1-5: High-level macro trends, sentimental "why we started" stories, and generic problem statements (e.g., "Software is fragmented").
The VC Reaction: I am currently on Slide 4, and I still do not know what you sell or who buys it. My internal monologue is not "Tell me more"; it is "Next." By the time I hit the financials on Slide 12—if I get there—I have already mentally bucketed you as 'unfocused.'
Why Founders Do This
This failure stems from Ego and Fear.
Ego: You believe your personal journey is material to the asset's value. It isn't. Only the outcome of that journey (revenue, IP, retention) has value.
Fear of Mechanics: Founders often bury the hard data (CAC, burn multiples, churn) behind fluff because the numbers aren't compelling. You use narrative as a smoke screen. We see through the smoke immediately. If the metrics are hard to find, we assume they are bad.
The Mathematical Proof / The "Why"
We can quantify the cost of a narrative-heavy deck using Cognitive Load Theory and Time-to-Insight (TTI) mechanics.
In a standard partner meeting, capital allocation decisions are modeled on risk-adjusted return. However, the screening process is modeled on Signal-to-Noise Ratio (SNR).
SNR = Valid Commercial Data Points
Total Seconds Consumed
If your deck requires 300 seconds to convey $2M ARR and 110% NRR, your SNR is low. If a competitor conveys the same data in 45 seconds, their SNR is 6.6x higher.
The Logic of the "Skim":
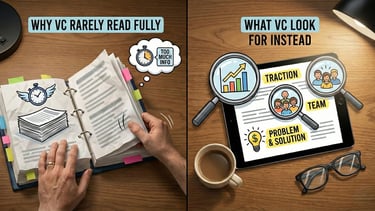
The Pattern Match Algorithm: VCs review 2,000+ decks a year to make 2-4 investments. We operate on pattern recognition, not deep reading. We scan for specific keywords and integers: "ARR," "MoM Growth," "CAC Payback," "LTV."
The "30-Second" Cliff: Probability of rejection spikes by 85% if the core business model isn't understood within the first 30 seconds.
The Cost of Ambiguity: Every second I spend trying to decipher a graph or a vague headline ("Reimagining the Future of Work") is a tax on my goodwill.
Ambiguity Cost = High Cognitive Load = Perception of Risk.
Clarity = Low Cognitive Load = Perception of Competence.
When you force a VC to "read," you are forcing them to work. In a market where capital is expensive (interest rates are non-zero), friction is fatal. We are not looking for a mystery novel; we are looking for an instruction manual on how you will turn $5M into $50M.
The "Insider" Solution Protocol
To survive the 140-second scan, you must abandon the "story" format and adopt the "Executive Dashboard" Protocol. You are not pitching a dream; you are presenting an asset for acquisition or partnership.
The "Before vs. After" Comparison
Weak Version (The "Novelist"):
Slide Title: "The struggle of modern data teams."
Content: A generic stock photo of a stressed worker, three paragraphs of text about data silos, and a quote from a Gartner report.
VC Takeaway: "Fluff. No proprietary insight."
VC-Ready Version (The "Forensic Audit"):
Slide Title: "Problem: Data Silos Cost Enterprise Clients $4M/Year in Lost Productivity."
Content: A split-screen graphic. Left side: "Current State" (Manual SQL queries, 48-hour delay). Right side: "Our Solution" (Automated pipelines, instant query).
Metric Overlay: "Beta customers reduced query time by 90%."
VC Takeaway: "Quantifiable problem. Clear solution. measurable ROI."
The "6-Slide Skim" Framework
Design your deck so that the following 6 slides can stand alone. If I delete the rest of the deck, these must secure the meeting:
The "TL;DR" Teaser: This is not a title slide. This is a one-page summary of the entire business. Revenue, Growth Rate, Lead Investor, and Big Vision. Do not make me scroll to find your ARR.
The "hair-on-fire" Problem: Quantify the pain in dollars or hours. "Inefficiency" is not a problem; "Losing $20k per month per employee" is a problem.
The "Unfair Advantage" (Moat): Why can't Google kill you next Tuesday? Do not say "First Mover Advantage." Show me IP, network effects, or proprietary data moats.
The "Traction" Evidence: Use a line graph, not a cumulative bar chart (vanity metric). Show Monthly Recurring Revenue (MRR) growth over the last 18 months. Annotate the graph with key hires or product launches to show causality.
The Unit Economics: This is the most scrutinized slide.
Equation: Show me that $LTV > 3 \times CAC$.
Payback: Show me you recover customer acquisition costs in <12 months.
Retention: Net Revenue Retention (NRR) must be >100% for B2B SaaS.
The "Ask" & Use of Funds: Be precise. "Raising $3M to achieve $2M ARR in 18 months." Breakdown the spend: 40% Eng, 40% Sales, 20% Ops.
The "Skim Test": Give your deck to a stranger. Give them 20 seconds. Take it away. Ask them: "What do we sell, and how much money do we make?" If they can't answer, burn the deck and start over.
The "Death Traps"
In attempting to optimize for the "skim," founders often over-correct and fall into these lethal traps:
The "Data Dump" Over-Correction: You pack 50 metrics onto one slide to look "analytical." This causes paralysis. Stick to the KPI Triad: Growth, Efficiency (Burn/CAC), and Retention. Anything else belongs in the Appendix.
The "2021 Valuation" Delusion: Do not anchor your valuation expectations to the outlier multiples of the ZIRP (Zero Interest Rate Policy) era. If you present a 50x ARR multiple in 2026, you signal financial illiteracy. We audit based on current public market comps, discounted for illiquidity.
The "Frankenstein" Design: Do not mix three different fonts and color schemes because you copied slides from different versions. Inconsistency in design signals inconsistency in operations. "Attention to detail" is a proxy for "operational excellence."
The "High-Ticket" Conclusion
The delta between a "readable" deck and a "skimmable" deck is often the difference between a passed email and a term sheet. By optimizing for the 140-second forensic audit, you reduce the VC's cognitive load, signaling that you respect their time and understand the mechanics of scaling. Fixing this structure doesn't just make you look better; it can arguably add $1M+ to your pre-money valuation by creating scarcity through speed.
For the complete architectural breakdown of a winning fundraise, refer to How VC Pitch Decks Really Work in 2026 — And Why Most Founders Get Them Wrong.
The Filter Plug:
You can attempt to reverse-engineer this structure manually and risk getting the hierarchy wrong, or you can use the Slide-By-Slide VC Instruction Guide included in our $5k Consultant Replacement Kit ($497) available on the home page. It dictates exactly what data goes in which pixel, ensuring your deck survives the autopsy.
Funding Blueprint
© 2026 Funding Blueprint. All Rights Reserved.