Pitch Deck Visual Mapping: Linking Problem, Root Cause, and Solution
Stop making VCs guess. Skipping the Root Cause layer kills Series A deals. Learn the 3-Node Logic Chain to build a fundable causal narrative today.
2.4 CONNECTING PROBLEM → SOLUTION LIKE A VC (NARRATIVE LOGIC MODEL)
2/21/20266 min read
Pitch Deck Visual Mapping: Linking Problem, Root Cause, and Solution
You will not get a second meeting. Here is the slide structure that closed that door before you left the room.
Your Problem Slide identified a real pain. Your Solution Slide described a functional product. But you skipped the layer between them — the root cause — and the VC sitting across from you spent your entire pitch waiting for a logical connection that never arrived. That gap is not a narrative preference; it is the structural fault that separates a fundable deck from one that gets politely deferred. The discipline of closing it is central to building a VC-grade Problem-to-Solution narrative that holds under partner scrutiny, and most founders do not know the layer is missing until the deal is already gone.
Why Skipping the Root Cause Layer Is a Series A Logic Failure, Not a Design Problem
Here is the precise failure this creates: a VC sees your Problem Slide, accepts the pain as real, then watches you jump directly to your product as the answer. What their brain is doing in that gap — involuntarily — is asking why the problem exists in the first place. If your deck does not answer that question before your Solution Slide, the investor answers it themselves. And the answer they construct may have nothing to do with your product.
This is not a presentation critique. It is a logical vulnerability. If the VC's self-constructed root cause does not match your solution mechanism, your product looks like a guess, not an engineered response. The investment thesis collapses before you reach traction.
The structure most founders use looks like this:
Problem → Solution
The structure that closes Series A rounds looks like this:
Problem → Root Cause → Solution (as the direct elimination of that root cause)
I have seen this three-layer structure missing in nine out of twelve decks reviewed in the first quarter of this year — every one of those founders reported the same partner feedback: "We love the space but aren't convinced by the approach." That sentence is the polite translation of a broken causal chain.
The psychological reason founders skip the root cause layer is speed. They are so close to their own product that the causal logic feels obvious — of course the problem exists because of X, of course their product eliminates X. That internal obviousness does not transfer to a slide unless it is made explicit. Assuming shared context with a VC who has seen forty decks this week is a structural error with a financial consequence.
The Three-Node Logic Chain: Why the Math of Causal Mapping Protects Your Valuation
As of early 2026, top-tier US and UK Series A funds are running a due diligence checkpoint that analysts informally call "the mechanism question" — does this solution actually address the structural cause of the problem, or is it treating a symptom? Funds that have recalibrated post-2023 are explicitly stress-testing this because symptomatic solutions in that vintage produced high churn and weak net revenue retention. They are not making that mistake again.
The causal logic your deck must demonstrate follows a three-node chain. Here is how the math of that chain works:
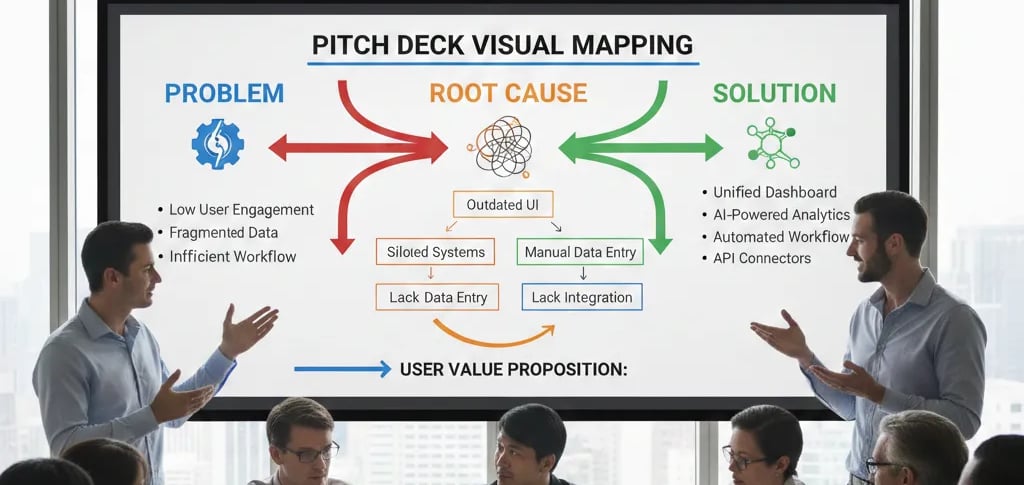
Node 1 — The Problem (Observable): A measurable pain with a quantified cost. "Enterprise procurement teams lose an average of $340K annually to duplicate vendor payments."
Node 2 — The Root Cause (Structural): The specific system failure or gap that produces the problem. "The root cause is the absence of a real-time cross-referencing layer between ERP invoice intake and the approved vendor master — finance teams are reconciling these manually, in arrears, using spreadsheets."
Node 3 — The Solution (Causal Elimination): A product that directly removes the root cause. "Our system inserts an automated cross-reference check at the point of invoice ingestion — before payment processing — eliminating the reconciliation gap at its source."
Map your own deck against this table:
Pitch Deck Risk Assessment
High Risk:
Deck Content: Shows Problem $\rightarrow$ Solution but lacks a root cause.
VC Perception: "Interesting product, unclear why it works."
Outcome: Fails the mechanism test.
Medium Risk:
Deck Content: Shows Problem $\rightarrow$ Root Cause but lacks solution clarity.
VC Perception: "They understand the space but not their own product."
Outcome: Requires a rebuild.
Low Risk:
Deck Content: Shows an aligned flow of Problem $\rightarrow$ Root Cause $\rightarrow$ Solution.
VC Perception: "This is an engineered response to a structural failure."
Outcome: Result is a fundable thesis.
The diagnostic equation: Solution Validity = (Root Cause Eliminated) ÷ (Problem Nodes Addressed). If your solution eliminates the root cause directly, the score is 1.0. If it treats a downstream symptom, the score drops — and so does investor confidence in defensibility.
The Visual Mapping Protocol: How to Build the Three-Layer Causal Diagram Across Two Slides
This is not a theoretical framework. It is a slide construction method.
Step 1: Write the Root Cause Before You Touch the Deck. Open a blank document. Write one sentence that completes this structure: "This problem exists because [specific system failure], which means [specific consequence] occurs [at what frequency or scale]." This sentence becomes the hidden spine of your Problem Slide — it does not always appear verbatim, but every visual and data point on that slide must point toward it.
Step 2: Build the Problem Slide as a Causal Diagram, Not a Pain Description. Most Problem Slides describe what hurts. A VC-ready Problem Slide describes what breaks — the specific process failure, decision gap, or structural absence that generates the pain. The visual difference:
Weak Version: A slide showing a frustrated user persona with bullet points listing inefficiencies. ("Slow," "Expensive," "Error-prone")
VC-Ready Version: A process flow diagram showing steps 1 through 6 of the actual workflow, with Step 4 isolated in red. A callout reads: "No automated validation at ingestion — gap generates 340K in duplicate payments annually." The root cause is visualised at the point of failure, not described in a caption.
Step 3: Open the Solution Slide by Resolving Step 4. The Solution Slide does not introduce a new diagram. It returns to the same workflow. Step 4 is now replaced by your product's mechanism, marked in your brand colour. The metric attached is the elimination of the cost: "Automated at ingestion — duplicate payments reduced to zero across three enterprise pilots."
This visual continuity — same workflow, same step number, same layout — is what creates the "logical snap" the VC is waiting for. Their brain completes the pattern without effort. That is the goal.
Step 4: Apply the "Cause-Removal Test" to Your Solution Slide. Read your Solution Slide aloud. For every claim your product makes, ask: "Is this claim the direct removal of the root cause I identified, or is it a feature description?" Feature descriptions belong in the product appendix. Cause-removal claims belong on the Solution Slide. If you cannot pass this test out loud, the VC will fail it silently and move on.
The equation: Root Cause (Named + Visualised) + Solution (Same Mechanism, Visually Resolved) = Causal Credibility.
Three Ways Founders Break the Causal Chain While Trying to Build It
1. Naming the root cause but not visualising it. Writing "root cause: lack of integration between systems" as a bullet point is not causal mapping. It is a label. The root cause must be shown at the point in the workflow where it occurs — a visual location, not a text description.
2. Misidentifying the root cause as a market condition. "The problem exists because the market lacks a good solution" is not a root cause — it is a market gap statement. Root causes are internal to the customer's process: a missing step, a broken handoff, a manual decision that should be automated. Confusing these produces a solution that sounds like a product search rather than an engineered fix.
3. Using a different visual format on the Solution Slide. If your Problem Slide is a process flow and your Solution Slide is a product screenshot, you have broken the visual chain. The VC's brain cannot complete the pattern match. Visual continuity across both slides is not aesthetic — it is logical infrastructure.
The Commercial Impact of a Closed Causal Chain
A deck that runs Problem → Root Cause → Solution without a logical gap does something specific to the partner conversation: it shifts the VC's questions from "Does this work?" to "How big can this get?" That is a materially different room to be in. The first set of questions is defensive; the second is commercial. Founders who close the causal chain spend less time justifying their product and more time negotiating their terms — and in a market where median US Series A pre-money sits at $22M–$28M, that negotiating position is where valuation is actually set.
The complete system for engineering this narrative logic across your full Problem and Solution Slides is in the Problem and Solution Slides framework built for Series A fundraising.
Every week this causal gap sits unfixed in your deck, it is costing you a partner meeting you will not be offered twice. The Slide-By-Slide VC Instruction Guide inside the $5K Consultant Replacement Kit maps the exact three-node structure across your Problem and Solution Slides — built to the standard that analyst pre-screens are checking against in current vintage funds. The full Kit is $497. Get it at the Series A pitch deck system that closes the causal gap VCs test for.
Funding Blueprint
© 2026 Funding Blueprint. All Rights Reserved.