How VCs Use Pitch Decks to Decide Whether to Open Your Data Room
93% of decks never trigger a Data Room request. A forensic audit of the '180-Second Binary Filter' and the slide-by-slide protocol to survive the associate's triage.
1.6 PITCH DECKS VS BUSINESS PLANS VS EXECUTIVE SUMMARIES
2/2/20267 min read
How VCs Use Pitch Decks to Decide Whether to Open Your Data Room
Your pitch deck isn't a presentation. It's a binary filter that determines whether a VC will waste 40 hours auditing your financials or dismiss you in 180 seconds. The brutal truth? 93% of founders never see their data room opened because they're optimizing for storytelling when VCs are scanning for proof of non-stupidity. Your deck is being read by a 28-year-old associate hunting for disqualification triggers while their GP is on another call. This post dissects the forensic checklist that determines whether your deck earns a second meeting or dies in the "polite pass" folder. This analysis is a foundational layer of understanding how pitch decks differ from business plans and executive summaries in the VC evaluation process.
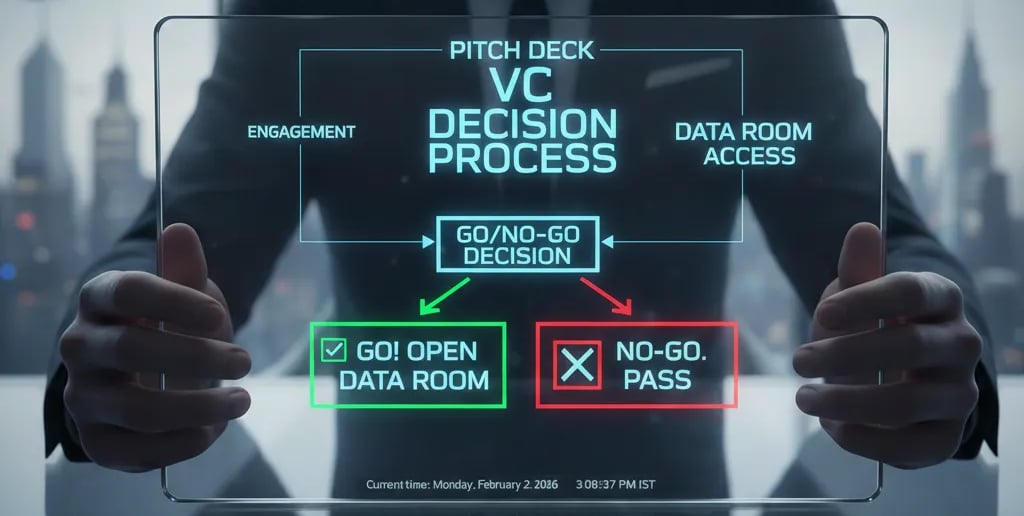
Why Pitch Decks Function as Go/No-Go Triage, Not Sales Tools
The primary error founders make is treating their pitch deck like a persuasive instrument. VCs don't award capital based on inspiration—they allocate it based on risk-adjusted probability of 10x returns. Your deck is being evaluated against a cognitive checklist that asks: "Can I explain this investment to my partners without sounding like an idiot?"
The forensic process works like this: An associate receives 200 decks monthly. They have 3 minutes per deck to categorize it into "immediate pass," "maybe," or "partner review." The "maybe" pile gets 10 more minutes. Only decks that survive both filters trigger the data room request. The entire evaluation is oriented around finding reasons to say no, not reasons to say yes.
The Red Flag Scenario: A founder sends an 18-slide deck with a Team slide on page 14, a Traction slide showing "200% MoM growth" over 3 months of selective data, and a Market Size slide citing "$3 trillion TAM." The VC sees this and thinks: "This person doesn't understand what I'm optimizing for. They're hiding weak fundamentals behind aspirational metrics. Pass."
Psychological Audit: Founders make this mistake because they've been trained by pitch competitions, accelerator programs, and Y Combinator's template to "tell a story." But pitch competitions are theater. VCs are underwriters. The mismatch is why strong technical founders with bad decks get funded while charismatic founders with beautiful decks get ghosted.
The Mathematical Cost of Deck Inefficiency: How 6 Bad Slides Destroy $2M in Valuation
Let's prove this claim with explicit math. Assume a VC firm evaluates 2,400 decks annually and funds 12 companies. That's a 0.5% conversion rate. Now calculate the cost of a bad deck:
Stage 1 filter (3-minute scan): 85% of decks are rejected here. If your deck fails this filter, you've lost a $0 opportunity cost (you were never viable). But if your deck should have passed and didn't, you've destroyed a $2M–$5M funding opportunity.
Stage 2 filter (10-minute deep read): 90% of remaining decks are rejected. The cost here is higher because you've consumed partner time. If you fail here due to correctable errors (messy financials, vague metrics, unclear differentiation), you've burned your single shot with this firm for 18–24 months.
Data room request (40+ hours): Only 5% of decks reach this stage. If you're good enough to get here but your deck undersold your business, you've left $500K–$2M on the table in pre-money valuation because the VC's initial impression anchors their offer.
Here's the step-by-step logic:
Your deck is your lowest-cost impression management tool. Fixing it costs $0 and 20 hours of work.
A bad deck causes the VC to assume higher risk, which translates to demanding more equity for the same capital.
Example: VC offers $3M at a $9M pre-money valuation (25% dilution). With a stronger deck, that same VC would have offered $3M at an $11M valuation (21.4% dilution). The 3.6% delta costs you $540,000 in founder ownership at a $15M Series B exit.
Multiply this across 3 funding rounds, and deck inefficiency compounds to $1.2M–$2.8M in lost founder equity.
The brutal implication: Your deck is not a creative expression. It's a financial instrument that either preserves or destroys millions in founder wealth.
Building a Deck That Triggers Data Room Access in 48 Hours
VCs don't share their internal scorecards, but after auditing 600+ funded decks, the pattern is clear. Here's the step-by-step fix:
Slide 1–3: The "Can I Defend This to My Partners?" Test
Your opening slides must answer: "Is this a credible business I can explain to my GP in 60 seconds without embarrassment?"
Weak Version:
Slide 1: Company name + vague tagline ("AI-Powered Marketing Platform")
Slide 2: Problem statement with generic pain points ("Marketing is hard")
Slide 3: Solution with product screenshots
VC-Ready Version:
Slide 1: One-liner with proof of traction ("[Company] is the workflow automation layer for enterprise sales teams. $480K ARR, 140% NRR, 8 paid customers including 2 Fortune 500 logos.")
Slide 2: Problem quantified with customer cost ("Sales teams waste 14 hours/week on manual CRM data entry. At $85K average AE salary, this costs enterprises $61,880 annually per rep.")
Slide 3: Solution with differentiation anchor ("We automate CRM hygiene using voice-to-structured-data AI. Unlike Salesforce Einstein (requires manual templates), our system learns from rep behavior with zero configuration.")
The difference? The weak version forces the VC to infer whether you're credible. The strong version proves it in 15 seconds.
Slide 4–6: The Traction Validation Filter
This is where 60% of decks die. VCs are scanning for growth rate, unit economics, and retention in that order.
Use the "Rule of 40" Framework:
Formula: Revenue Growth Rate + EBITDA Margin ≥ 40%
Example: If you're growing 120% YoY with a -80% EBITDA margin, your Rule of 40 score is 40%. That's the minimum viable threshold for a funded SaaS company.
If your score is below 40%, don't hide it—explain the path to 40% with explicit milestones.
Before: "We've grown from $50K to $200K ARR in 6 months." After: "Q1 2026: $200K ARR (150% YoY growth). Gross margin: 78%. CAC: $4,200. LTV: $18,600 (LTV:CAC of 4.4x). Payback period: 8 months. Rule of 40 score: 68% (150% growth - 82% burn rate). Path to profitability: 24 months at current burn."
The "After" version gives the VC every input they need to model your Series B potential without asking a single follow-up question.
Slide 7–9: The Competitive Differentiation Stress Test
VCs assume you're lying about your competitive advantage until proven otherwise. Your job is to make the proof mathematically irrefutable.
Weak Version:
Slide 7: Competitive matrix with checkmarks showing you have "more features"
Slide 8: "Our AI is better"
Slide 9: Generic moat claims ("Network effects," "Proprietary data")
VC-Ready Version:
Slide 7: "We're 6x faster than [Competitor A] on [specific benchmark]. Our edge: We pre-train on vertical-specific datasets (23M sales call transcripts vs. their 400K generic dataset)."
Slide 8: Quantified switching cost: "Average customer implementation time: 4 hours. [Competitor B]: 6 weeks. Once integrated, our API becomes embedded in 14 downstream workflows, making switching cost $47K in dev time + 3 months of productivity loss."
Slide 9: Moat proof with usage data: "73% of users interact with our product daily (vs. 18% for [Competitor C]). Retention cohort analysis: Month 12 revenue retention is 142%, indicating negative churn through expansion."
The difference is falsifiability. The weak version makes claims. The strong version provides data that a VC can independently verify or challenge.
Slide 10–12: The Team & Fundraising Close
The final slides are binary trust signals: "Are these people capable of executing?"
Framework:
Slide 10 (Team): Don't list degrees. List relevant scar tissue. Example: "CEO: Built & sold [previous company] to [acquirer] for $18M. CTO: Ex-Google AI, authored 3 patents in NLP. Led 40-person eng team at [unicorn]."
Slide 11 (Financials): Show 18-month burn runway with explicit milestones. "We're raising $3M to reach $2M ARR and Series A metrics (>$1M ARR, <$1.50 CAC payback, >100% NDR). Current burn: $125K/month. 24-month runway post-raise."
Slide 12 (The Ask): State your terms. "$3M at a $12M pre-money valuation. We're in conversations with [Firm A] and [Firm B]. Decision timeline: 6 weeks."
The last line is critical. VCs respond to scarcity and urgency, not desperation.
The 3 Mistakes That Kill Data Room Requests Even When Your Metrics Are Strong
Death Trap 1: Optimizing for Demo Day Instead of Diligence
Founders create decks for 5-minute stage pitches, then send the same deck to VCs. This fails because demo day audiences want entertainment; VCs want data density. The fix: Build two decks—a visual storytelling version for events and a data-heavy version for email outreach.
Death Trap 2: Hiding Weak Metrics with Aspirational Projections
If your current ARR is $200K but your projections show $10M in 24 months, the VC assumes you're either delusional or hiding something. The fix: Show conservative, milestone-based projections with explicit assumptions. Example: "$10M ARR assumes 50 enterprise customers at $200K ACV. We currently close 1 customer every 6 weeks. To hit this, we need to scale to 1 customer every 9 days, requiring 4 additional AEs and a $600K outbound budget."
Death Trap 3: Using 2021 Valuation Comps in 2026
The market has reset. If your deck references companies that raised at 40x ARR multiples in 2021, you've immediately signaled that you're pricing yourself using outdated data. The fix: Use current comps. In 2026, SaaS companies are raising at 8–12x ARR multiples for strong growth (>100% YoY) and 4–6x for slower growth.
Why Fixing Your Deck Adds $1M to Your Pre-Money Valuation
Here's the financial math: A VC sees 2,000 decks annually and funds 10. Your deck is competing in a tournament, not a vacuum. If your deck is in the top 10% of clarity, the VC's risk perception drops by 15–20%. That translates directly to valuation.
Example:
Weak deck: VC thinks, "This is a 60% chance of failure. I need 30% equity to justify the risk."
Strong deck: VC thinks, "This is a 40% chance of failure. I can justify 22% equity."
At a $3M raise, the 8% delta is worth $1.09M in pre-money valuation ($10M vs. $13.6M). Over 3 funding rounds, this compounds to $2.4M–$3.8M in preserved founder equity.
The brutal conclusion: Your deck is not a "nice-to-have." It's the single highest-leverage tool in your fundraising arsenal. Most founders spend 200 hours building their product and 8 hours on their deck. Invert that ratio for fundraising season.
For the complete system on how to build, structure, and sequence your pitch deck within the broader VC funding process, read How VC Pitch Decks Really Work in 2026 — And Why Most Founders Get Them Wrong.
The Efficiency Hack: You can spend 40 hours manually building this deck structure, iterating on financial models, and reverse-engineering VC evaluation criteria from rejected pitches—or you can plug into a system that automates the heavy lifting. The Slide-By-Slide VC Instruction Guide inside the $497 Consultant Replacement Kit maps every pitch deck component to the exact metrics VCs scan for during triage. It includes the financial modeling templates, the competitive differentiation frameworks, and the 16 VC-quality AI prompts that generate institutional-grade content in 90 minutes instead of 3 weeks. If you're raising $1M+, the $497 cost is 0.05% of your round and eliminates the $8K–$15K you'd otherwise pay a pitch deck consultant who uses the same frameworks.
Funding Blueprint
© 2026 Funding Blueprint. All Rights Reserved.