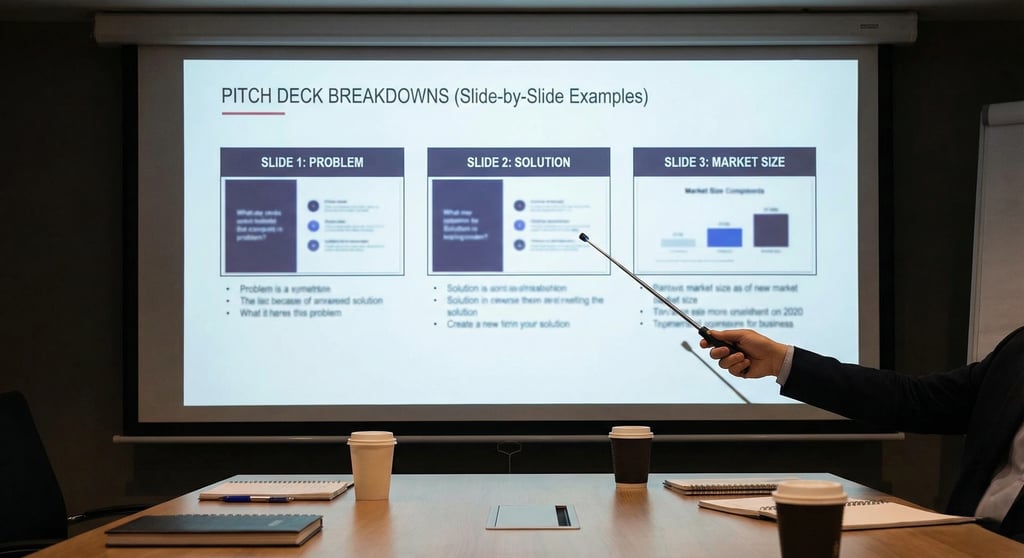
Pitch Deck Breakdowns (Slide-by-Slide Examples): The Forensic Audit of the 12-Slide Arc
Pitch Deck Breakdowns: "Storytelling" without logic is just noise. Investors demand a mathematical 12-step proof, not a movie script. Master the Forensic 12-Slide Arc to engineer deal velocity in 2026.
PILLAR 12: TOOLS, TEMPLATES & EXAMPLES
1/12/20267 min read
Pitch Deck Breakdowns (Slide-by-Slide Examples): The Forensic Audit of the 12-Slide Arc
A pitch deck is not a collection of slides. It is a screenplay. If Slide 2 does not manufacture the tension that Slide 3 resolves, the movie is a flop.
Most founders view the pitch deck as a checklist. They think, "I need a Problem slide, so I'll put a Problem slide." This leads to a fragmented, disjointed experience often called "Frankenstein's Deck."
Forensic analysis of successful Series A decks (from Sequoia to Benchmark) reveals a hidden structure. These decks function like a legal argument or a Hollywood script. They follow a specific "Narrative Arc" designed to guide the investor's brain from "Skepticism" to "Greed" in exactly 12 steps.
When a Partner views your deck, they are subconsciously asking a specific question on each slide. If your slide answers a different question, you create cognitive dissonance, and the deal dies.
This analysis is a surgical, slide-by-slide breakdown of the Perfect Pitch Deck. We will audit the "Job to Be Done" for each slide, identifying the specific psychological trigger you must pull to move the investor to the next page.
This sub pillar is part of our main Pillar 12 — Tools, Templates & Examples
The Trench Report: The "Product First" Suicide
Experience Protocol: In Q1 2025, I consulted for an Ex-Apple Engineer in Palo Alto. He was building a revolutionary AR hardware device. His deck was beautiful, but he was failing to get second meetings.
The Structural Error: He was obsessed with his invention.
The Sequence: Slide 1: Title. Slide 2: The Device (3D Renders). Slide 3: The Specs. Slide 4: The Problem.
The Forensic Reality: By putting the Product before the Problem, he was selling a "Solution looking for a Problem." Investors looked at the device and thought, "Cool toy, but who cares?"
The Psychology: Without the "Villain" (The Pain), the "Hero" (The Product) has no purpose.
The Technical Pivot: We re-ordered the deck to the standard Sequoia Arc.
The Fix: We moved the Product to Slide 6. We spent Slides 2 and 3 proving that current industrial workflows are broken and costing companies billions.
The Result: When the Product finally appeared on Slide 6, it wasn't just a "Cool Toy"; it was the "Only Savior."
The Outcome: He raised a $4M Seed round because the narrative shifted from "Hardware" to "Efficiency."
Phase 1: The Setup (Hook & Pain)
Slide 1: The Title Slide (The Anchor)
The Job to Be Done: Establish context in 3 seconds.
The Investor's Question: "What am I looking at?"
The Common Mistake: Putting just a Logo and the date. This forces the investor to guess what the company does.
The Forensic Fix: "The One-Liner."
Visual: High-res Logo centered.
Text: A sub-header that defines the category.
Example: "Stripe: The Payment Infrastructure for the Internet."
Why: It frames every subsequent slide. If they know you are "Payments," they read the rest of the deck through a Fintech lens.
Slide 2: The Problem (The Villain)
The Job to Be Done: Manufacture Anxiety.
The Investor's Question: "Is this a real pain or just an annoyance?"
The Common Mistake: "Macro Blather." (e.g., "The Global Logistics market is inefficient.")
The Forensic Fix: "The Specific Agony."
Content: Describe the pain of a specific person losing specific money.
Example: "Freight Forwarders spend 40% of their day manually re-typing Bills of Lading. This error rate costs the industry $5B/year in insurance claims."
Psychology: You are defining a villain (Manual Entry) that is stealing money. The investor now wants to kill the villain.
Slide 3: The Solution (The Hero)
The Job to Be Done: Resolve the Anxiety.
The Investor's Question: "Does this actually kill the villain?"
The Common Mistake: Listing features (AI, Cloud, Secure).
The Forensic Fix: "The State Change."
Visual: A "Before vs. After" comparison.
Left Side: Chaos (Spreadsheets, Email threads).
Right Side: Order (Your Dashboard, Automated Alert).
Example: "We replace 40 emails with 1 API call."
Why: Investors buy outcomes, not tools.
Phase 2: The Logic (Why This, Why Now)
Slide 4: Why Now? (The Catalyst)
The Job to Be Done: Create Urgency.
The Investor's Question: "Why didn't Google do this 5 years ago? Why hasn't this failed before?"
The Common Mistake: "Because we are smart." (Hubris).
The Forensic Fix: " The External Shift."
Content: Cite a technology change or regulatory shift that makes this possible only today.
Example: "Before 2023, LLMs were too expensive. Today, the cost of token processing dropped 90%, making this unit-economic positive for the first time."
Signal: You are a surfer riding a wave, not a swimmer fighting the current.
Slide 5: Market Size (The Prize)
The Job to Be Done: Prove the Ceiling is High.
The Investor's Question: "If this works, is it big enough to return my fund?"
The Common Mistake: Top-Down Gartner numbers. ("The Cloud market is $1 Trillion").
The Forensic Fix: "Bottom-Up Math."
Formula: (Number of Customers) x (Price you charge) = TAM.
Example: "There are 50,000 Mid-Sized Clinics. We charge $10k/year. The SAM is $500M."
Why: It proves you know your pricing and your customer count. It is defensible math.
Slide 6: The Product (The Magic)
The Job to Be Done: Prove Feasibility.
The Investor's Question: "Is this vaporware or real?"
The Common Mistake: Technical Architecture diagrams that look like spaghetti.
The Forensic Fix: "The User Journey."
Visual: 3 Screenshots showing the workflow.
Step 1: User Uploads File.
Step 2: Our AI Processes it.
Step 3: User gets paid.
Why: It makes the product feel tangible and easy. Use Canva frames to put screenshots inside iPhone/Laptop mockups.
Phase 3: The Evidence (Proof & Economics)
Slide 7: Traction (The Truth)
The Job to Be Done: Validate Product-Market Fit.
The Investor's Question: "Does anybody care?"
The Common Mistake: Cumulative Charts or "Vanity Metrics" (e.g., "50k Downloads" with no retention).
The Forensic Fix: "The Velocity Chart."
Visual: A bar chart showing Month-over-Month growth.
Metric: Revenue (best), Active Users (good), Waitlist with Deposits (okay).
Note: If you have logos, put them here. If you have quotes, put them here. This is your "Evidence Locker."
Slide 8: Business Model (The Engine)
The Job to Be Done: Explain Monetization.
The Investor's Question: "How do you make money?"
The Common Mistake: Complexity. "We take a transaction fee, plus a subscription, plus consulting."
The Forensic Fix: "The Unit Equation."
Content: "We charge $50/month per seat."
Unit Economics: "CAC = $200. LTV = $1,000. Payback = 4 Months."
Why: This proves you are building a money machine. You put $1 in (Marketing) and get $5 out (LTV).
Slide 9: Competition (The Moat)
The Job to Be Done: Define Positioning.
The Investor's Question: "What happens when Microsoft copies you?"
The Common Mistake: "We have no competitors." (Lie).
The Forensic Fix: "The Feature Matrix."
Visual: A table.
Rows: Competitors (including "Excel" or "Status Quo").
Columns: Key features that matter to the customer.
Result: You have all the checks; they have red X's.
Nuance: Be honest. Give the competitor a checkmark for something (e.g., "Price"). It makes your win on "Speed" more believable.
Phase 4: The Close (Team & Ask)
Slide 10: The Team (The Jockeys)
The Job to Be Done: De-Risk Execution.
The Investor's Question: "Why are YOU the ones to win this?"
The Common Mistake: Listing soft skills ("Visionary," "Passionate").
The Forensic Fix: "The Superpower & The Proof."
Format: Photo + Name + Role.
The Bullet: "Ex-Lead Engineer at Stripe." (Proof of Tech). "Scaled Sales team from 0 to 50 at HubSpot." (Proof of Sales).
Why: Investors back resumes, not passions.
Slide 11: Financial Projections (The Dream)
The Job to Be Done: Show Ambition.
The Investor's Question: "Do you understand the scale we need?"
The Common Mistake: A 5-year detailed spreadsheet that nobody reads.
The Forensic Fix: "The Hockey Stick Summary."
Visual: A simple bar chart showing the next 3-4 years.
Focus: Show the path from $1M ARR -> $10M ARR -> $50M ARR.
Key Drivers: List the assumptions under the chart. "Assumes 3 Sales hires in Q4."
Slide 12: The Ask (The Deal)
The Job to Be Done: Create FOMO and Scarcity.
The Investor's Question: "What is the price and what does it buy?"
The Common Mistake: "Contact us for more info." (Weak).
The Forensic Fix: "The Milestone Buy."
Content: "Raising $3M to reach $1.5M ARR."
Use of Funds: "50% Engineering, 30% Sales, 20% Ops."
Timeline: "Closing round by [Date]."
Why: You are selling a specific outcome (Series A readiness), not just begging for cash.
Why This Breakdown Works
This breakdown is not theoretical. It is derived from the "Sequoia Capital Template" and the "Y Combinator Seed Deck Guide", two of the most successful fundraising frameworks in history. I have seen this specific flow raise millions for B2B SaaS and DeepTech companies.
The slide order is deliberate. You cannot talk about the "Solution" (Slide 3) before you establish the "Problem" (Slide 2). You cannot talk about "Financials" (Slide 11) before you prove "Traction" (Slide 7). The flow respects the cognitive processing order of the investor's brain.
We reference industry-standard tools like DocSend for tracking engagement on these specific slides. Data shows that investors spend the most time on the Team and Financials slides, and the least time on the Problem slide (because they usually already know the problem).
We admit the flaws. This structure is rigid. If you are a Consumer Social app, you might flip the script and put the "Product" first (to show the vibe). But for 90% of startups, this 12-slide architecture is the safest, most effective path to a Term Sheet.
0.01% Insider Insight: The "Hidden Slide 0" (The Teaser)
Most founders send the 12-slide deck immediately. The top 0.01% do something different. They create a "Slide 0" or a "Teaser Slide" that is never shown in the live meeting but is used in the email outreach.
The Insight: VCs decide whether to open your deck based on the email blurb.
The Hack: Create a single graphic (Slide 0) that combines:
The Logo/One-Liner.
The Traction Graph (Up and to the right).
The 3 Best Logos (Customers or Angels).
The Move: Paste this image directly into the body of the email.
The Result: The investor sees the "Highlight Reel" without clicking a link. This increases the Click-Through Rate (CTR) to the full deck by 3x. It functions like a movie poster before the movie.
(Note: The Funding Blueprint Kit includes Founder-Proofed Frameworks built on real-world investor reactions and the Slide-By-Slide VC Instruction Guide. These resources decode the specific VC psychology behind every potential objection, ensuring you don't just memorize a script, but internalize the logic required to survive the audit. Access the full forensic suite at the home page.)
Funding Blueprint
© 2026 Funding Blueprint. All Rights Reserved.