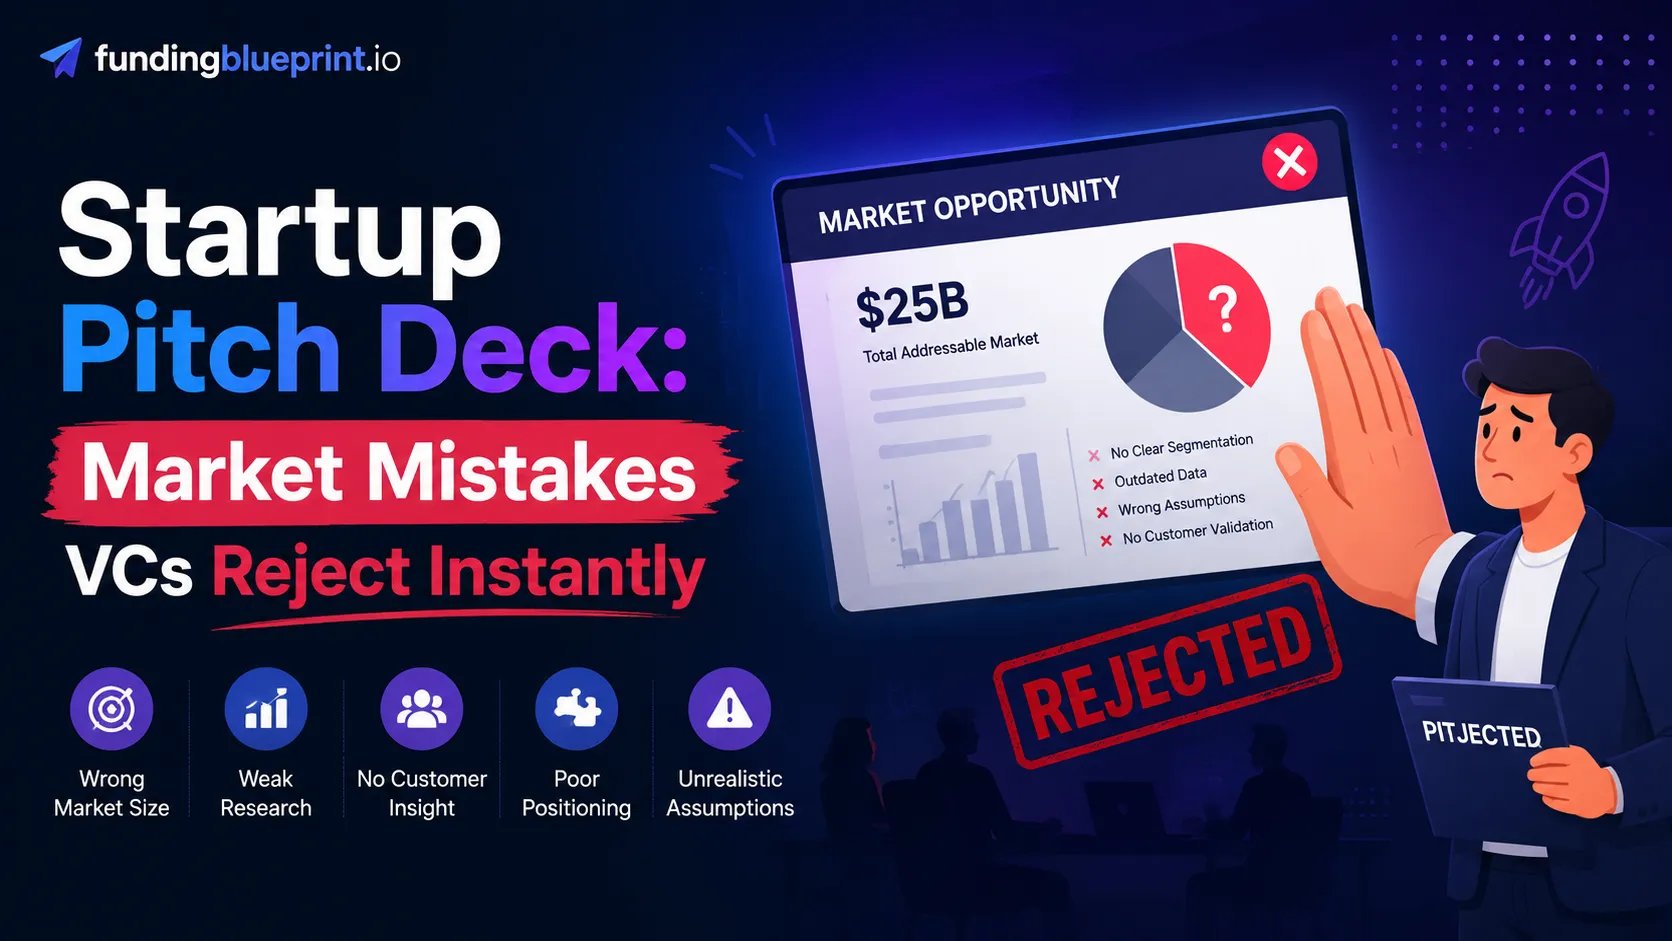
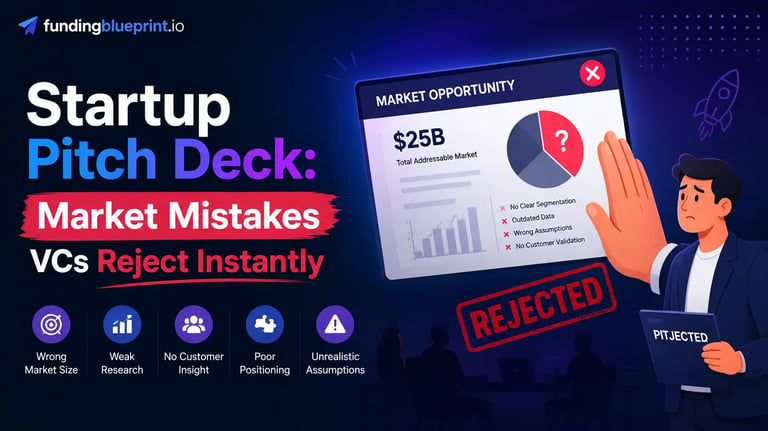
Market-Related Red Flags & Common Mistakes: The Forensic Audit of Opportunity
Market-Related Red Flags & Common Mistakes: Avoid the "TAM Fallacy" and "Inertia Cost" traps. Master the forensic audit benchmarks elite London and NYC VCs use to kill deals in 2026.
PILLAR 8: MARKET SIZE & COMPETITION
1/1/20268 min read


Market-Related Red Flags & Common Mistakes: The Forensic Audit of Opportunity
Market sizing is not an exercise in optimism; it is an exercise in constraint.
The most common lie in venture capital is the "One Percent Fallacy"—the belief that if a market is large enough, you only need to capture 1% to be a billionaire. This is false. In the forensic reality of high-stakes fundraising, markets are not passive pools of money waiting to be scooped up; they are active battlefields defined by "Wallet Share Inertia."
When a General Partner (GP) at a Tier-1 fund in London or New York reviews your "Market Opportunity" slide, they are not looking for big numbers. They are looking for "Addressable Reality." They want to know if you understand the difference between a "Total Market" (everyone who could use it) and an "Obtainable Market" (everyone who has the budget, authority, and technical capacity to buy it today).
A $10 Billion market that is shrinking is a trap. A $500 Million market that is growing at 40% CAGR (Compound Annual Growth Rate) is a goldmine. Most founders present the former and ignore the latter. This analysis is a surgical dissection of market sizing errors, designed to prevent you from being flagged as "Operationally Naive" during Technical Due Diligence.
This sub pillar is part of our main Pillar 8: Market Size & Competition
The Trench Report: The "Global TAM" Hallucination (A $20M Collapse)
In Q1 2025, I was brought in to audit a PropTech startup in Miami raising a $20M Series A. Their pitch was built on a massive number: "The Global Real Estate Market is $50 Trillion. We are the Operating System for Real Estate."
The Structural Error:
This is the classic "Top-Down" sizing error.
The Claim: They included every residential home in the world in their TAM (Total Addressable Market).
The Forensic Reality: Their software only worked for multi-family commercial units with centralized HVAC systems managed by property firms with >500 units.
The Audit: We ran a "Constraint Filter."
Exclude single-family homes (90% of the market).
Exclude buildings without centralized HVAC (50% of remainder).
Exclude Mom-and-Pop landlords (40% of remainder).
The Crash: Their actual TAM was not $50 Trillion; it was $4 Billion. The investors felt misled. The term sheet was pulled because the founder did not understand the difference between "Real Estate" (an asset class) and "Property Management Software" (a budget line item).
The Technical Pivot:
To resuscitate the deal, we had to abandon the "Global Domination" narrative and pivot to a "Niche Monopoly" narrative.
The Shift: We redefined the market from "Real Estate Software" to "High-Density HVAC Optimization."
The Math: We built a "Bottom-Up" model showing that while the market was smaller ($4B), the pain point in this specific niche was so acute (rising energy costs) that the startup could capture 40% market share in 3 years.
The Result:
The valuation was lowered, but the deal closed. The investors bought into a "High-Probability Niche" rather than a "Low-Probability Global Fantasy."
The Forensic Formula: Bottom-Up TAM
This is the only way to prove market size to a sophisticated investor. Stop quoting Gartner reports. Do the math yourself.
TAM = (Sigma) Total Qualified Accounts X Average Contract Value (ACV)
Forensic Logic: If you cannot list the accounts (or at least the specific firmographics of the accounts), you do not know your market.
Shutterstock
The "Addressability" Spectrum
Founders treat market sizing as a static number. In reality, it is a dynamic equation of friction. We analyze markets using the "Addressability Spectrum."
1. The "China Syndrome" (Red Flag)
The Mistake: "If we get just 1% of the Chinese market, we are rich."
The Reality: Capturing 1% of a fragmented market is harder than capturing 50% of a consolidated market. Getting 1% means you are fighting 1,000 competitors who all have local advantages.
The Correction: Focus on "Beachhead Density." Investors want to see you capture 20% of a specific zip code or vertical, not 0.001% of the world.
2. The "Static Budget" Error
The Mistake: Assuming the market size is fixed based on last year's spending.
The Reality: Great startups expand the market. Uber did not compete for the "Taxi Market" (which was small); they competed for the "Transportation Market" (which was huge) by inducing demand.
The Correction: Present a "Core TAM" (existing budget) and an "Expansion TAM" (budget you will unlock).
3. The "User vs. Buyer" Confusion
The Mistake: Counting "Employees" as your market when you sell "Enterprise Software."
The Reality: If you sell a $50k platform, your market is the number of companies with that budget, not the number of employees who log in.
The Correction: Always size by "Wallet Nodes" (entities with check-signing authority).
Regional Calibration (SF vs. London)
The way you present your market opportunity must shift based on the geography of the capital you are courting.
San Francisco (The "Blue Ocean" Vision)
The Thesis: SF investors (Benchmark, Sequoia) are looking for "Category Creation." They are less interested in how big the market is, and more interested in how big it will become if you succeed.
The Pitch: "The market for 'Personal Cloud Computing' does not exist yet. We are creating it. This will be a $100B industry in 10 years."
The Metric: Market CAGR (Compound Annual Growth Rate). They want to see a market growing at >20% annually. They are betting on the wave, not just the boat.
London / New York (The "Replacement Cycle" Audit)
The Thesis: London and NY investors are often looking for "Category Disruption." They want to know exactly whose lunch you are eating.
The Pitch: "The LegalTech market is $20B, currently dominated by legacy firms like LexisNexis. We are 10x faster and 50% cheaper. We will steal $200M of their revenue in 24 months."
The Metric: Market Share Velocity. How fast can you rip-and-replace the incumbent? They require proof of budget (e.g., "Law firms spend 3% of revenue on research tools").
Metric Logic & The 3 Red Flags
During Due Diligence, analysts look for specific structural flaws in your market logic. These "Red Flags" signal that you have not done the homework.
Red Flag 1: The "Top-Down" Lazy Calculation
The Error: "According to a Gartner report, the Cloud Security market is $50B. We will take 5%."
The Forensic Reality: Gartner reports are broad. They include services, hardware, and consulting. If you only sell software, 80% of that number is irrelevant to you.
The Correction: Never use a third-party report as your primary number. Use it only as a sanity check. Your primary number must be built Bottom-Up (Count times Price).
Red Flag 2: Ignoring "Shadow Competition" (Inertia)
The Error: "We have no competitors in this $10B market."
The Forensic Reality: If there are no vendors, the competitor is "Internal IT" or "Excel." The budget you are trying to capture is currently being spent on salaries for people doing the job manually.
The Correction: You must account for the "Switching Friction." If the market is $10B but it costs $5B to migrate the data, the Addressable market is only $5B.
Red Flag 3: The "Infinite User" Delusion
The Error: "Every human with a smartphone is our customer."
The Forensic Reality: No product is for everyone. Even Facebook is not for everyone (China is blocked, young teens are on TikTok).
The Correction: Define your "Serviceable Obtainable Market" (SOM). This is the slice of the market you can realistically capture with your current sales team and marketing budget within 18 months.
Forensic Formula: Market Efficiency Ratio ($MER$)
MER = LTV of Market Segment
CAC to Penetrate Segment
If the MER varies wildly between segments, you do not have one market; you have multiple distinct markets that require different strategies.
Earned Secrets
These are the hidden mechanics of market dynamics that generic advice ignores.
Secret 1: Regulatory TAM Shrinkage
In highly regulated sectors (FinTech, HealthTech), your TAM is not defined by demand; it is defined by Compliance.
The Secret: If you are a US FinTech, you cannot simply "expand to Europe." GDPR, PSD2, and local banking licenses act as "Market Firewalls." A $10B European market is effectively $0 until you spend $2M on legal compliance.
Action: Your roadmap must align with regulatory unlock. "We unlock the UK market in Q3 2026 upon receipt of FCA license."
Secret 2: The "Budget Flush" Cycle
Markets are not open 24/7. Enterprise markets have specific "Buying Windows."
The Secret: 40% of enterprise software is bought in Q4 (October-December) due to "Use it or Lose it" budget policies.
Action: If your GTM strategy assumes linear growth (8.3% per month), you will miss your targets. You must map your "Market Access" to the fiscal cycles of your buyers.
Secret 3: The "Adjacent Market" Upsell
The smartest founders under-promise on the core market and over-deliver on the adjacent market.
The Secret: Uber's core market was "Black Cars" (Small). Their adjacent market was "Logistics/Food" (Huge).
Action: Pitch the "Wedge." Show how winning a small, boring market (e.g., "Notary Services") earns you the right to enter a massive market (e.g., "Mortgage Origination").
Expert FAQ: The Unasked Questions
Q: Is a small market a deal-breaker?
A: Forensic Answer: Not necessarily. A "Small Market" ($500M) is investable if you can prove it is a monopoly niche with high margins and low churn. However, for a VC to get a 100x return, you eventually need a path to a >$1B opportunity.
Strategy: Frame the small market as the "Beachhead" (The Bowling Pin) that knocks down the wider industry.
Q: How do I cite sources without looking lazy?
A: Forensic Answer: Triangulate. "We calculated a Bottom-Up TAM of $4.2B based on 50k qualified accounts. This aligns with the Gartner top-down estimate of $4.8B, giving us high confidence in the 'Addressable Reality'."
Q: What is the difference between SAM and SOM?
A:
SAM (Serviceable Available Market): Everyone you could reach with your current product (e.g., All English-speaking SMBs).
SOM (Serviceable Obtainable Market): The share of the SAM you can realistically capture in the next 12-24 months given your budget and sales capacity (e.g., 5% of English-speaking SMBs).
Note: Investors judge your sanity based on the SOM, not the TAM.
Forensic Audit Checklist
Before you hit "Send" on your deck, run your Market Slide through this 5-point diagnostic:
The "CAGR" Check: Does your slide show the growth rate of the market? (A flat market is a dead market).
The "Source" Check: Are your citations < 12 months old? (Using a 2021 report in 2025 is an automatic fail).
The "Visual Grip" Test: Do you use the concentric circles correctly? (TAM > SAM > SOM).
The "Logic" Check: Is your math visible? "50k Companies x $10k ACV = $500M." (Show your work).
The "Constraint" Test: Have you explicitly stated who you are ignoring? (e.g., "We are ignoring the SMB segment for Phase 1"). Strategy is sacrifice.
Narrative Breadcrumb
You have sized the market with forensic precision. You have identified the "Serviceable Obtainable Market" and avoided the "1% of China" trap. You have proven that the opportunity is real, liquid, and accessible.
But knowing the market size is useless if you don't know who you are fighting for it. The next failure mode is misunderstanding the competitive dynamics. This leads us to the next critical pillar: "Competition Landscape & Competitive Advantage."
(Note: The Funding Blueprint Kit includes the "Forensic TAM Calculator." It forces you to build a Bottom-Up model using specific firmographic variables, automatically generating the 'Addressable Reality' numbers that Tier-1 investors demand. It also includes the 'SAM Saturation' simulator to model your market capture velocity. Access the full forensic suite at the home page.)


Funding Blueprint
© 2025 Funding Blueprint. All Rights Reserved.
