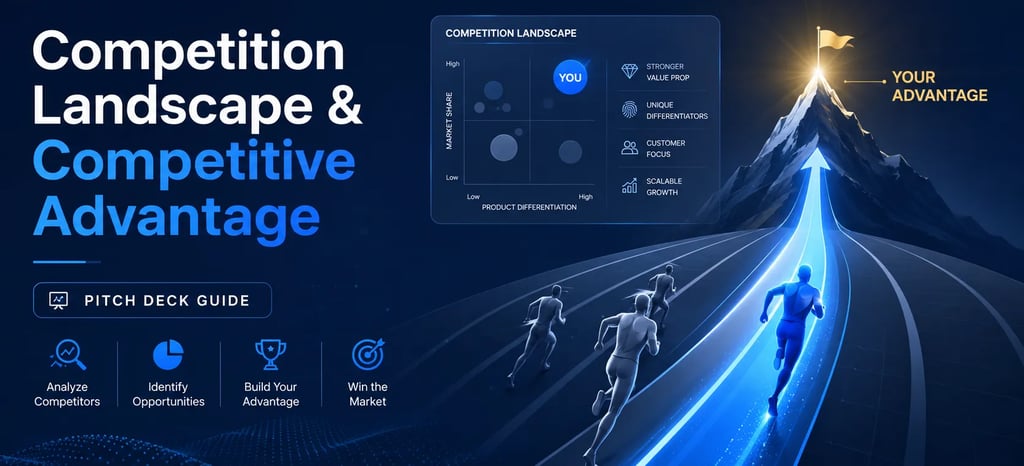
Competition Landscape & Competitive Advantage: Pitch Deck Guide
Discover how top-tier VCs read your competition slide in 8 seconds. Stop losing funding to hidden portfolio conflicts. Run our free pitch deck audit now.
PILLAR 8: MARKET SIZE & COMPETITION
12/31/20251 min read
Deep Dives: Competition Landscape & Competitive Advantage: Pitch Deck Guide
Funding Blueprint
© 2026 Funding Blueprint. All Rights Reserved.