Market Sizing That VCs Believe: TAM SAM SOM Guide
Discover market sizing that VCs trust with a forensic TAM SAM SOM framework. Avoid diligence red flags and build a fundable deck before investors decide. Read.
PILLAR 8: MARKET SIZE & COMPETITION
12/30/20251 min read
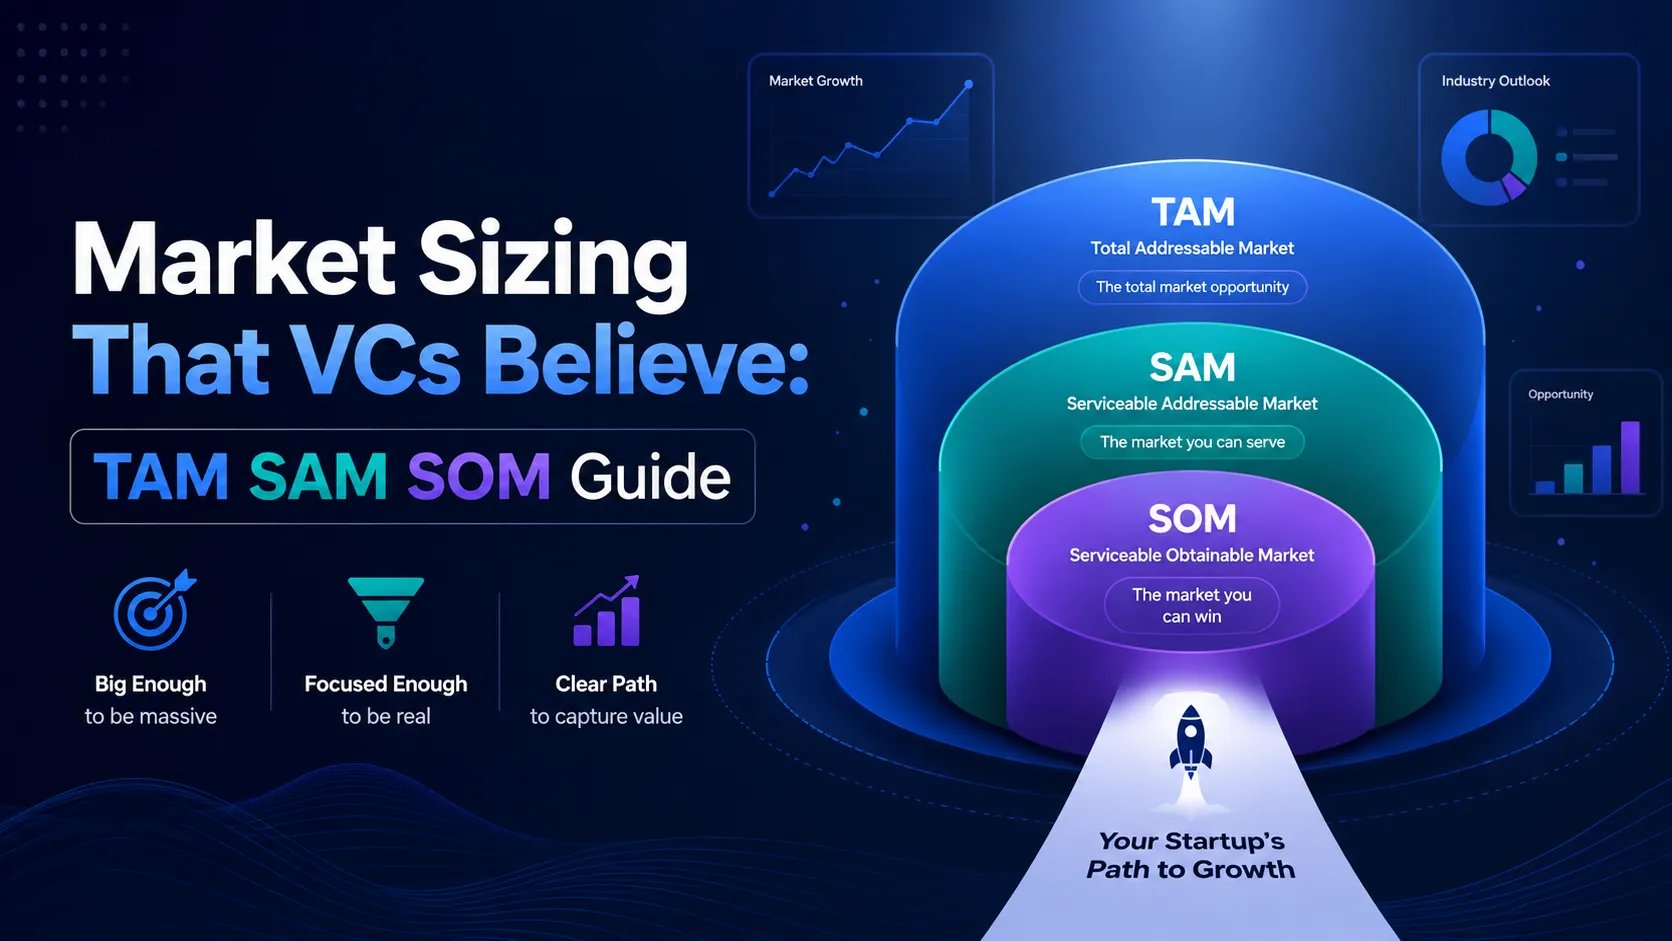
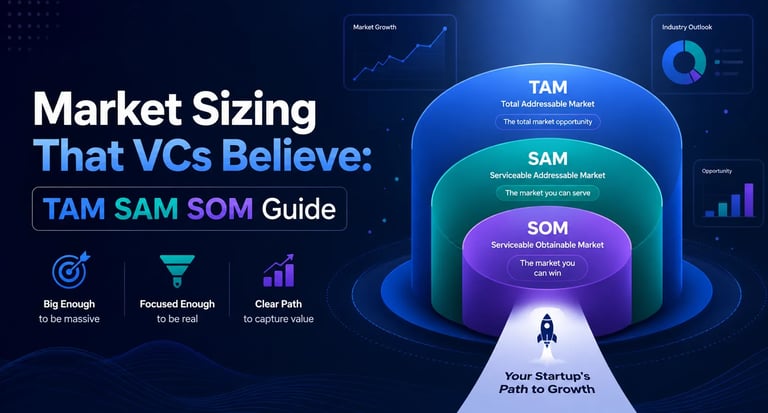
Forensic Deep Dives: Market Sizing That VCs Believe: TAM SAM SOM Guide
Funding Blueprint
© 2026 Funding Blueprint. All Rights Reserved.