Why Weak Traction Presentation Causes Instant Rejection
Stop showing growth without an engine. Discover the 3-layer traction architecture VCs demand: Cohort Curves, LTV:CAC ratios, and the Rule of 40 filter.
1.9 HOW BAD PITCH DECKS KILL DEALS INSTANTLY
2/11/20265 min read
Why Weak Traction Presentation Causes Instant Rejection
Most founders believe they lost their Series A because their CAC was too high or their burn was unsustainable. They're wrong. You lost because your traction slide told the VC you don't understand your own business. When a partner sees a founder confusing vanity metrics with proof of product-market fit, the decision isn't "pass for now"—it's "never fund this team." This specific failure mode is why bad pitch decks kill deals before founders even enter the room, and it's surgically correctable if you know what investors are actually measuring.
Why Misrepresented Traction Functions as Immediate Disqualification
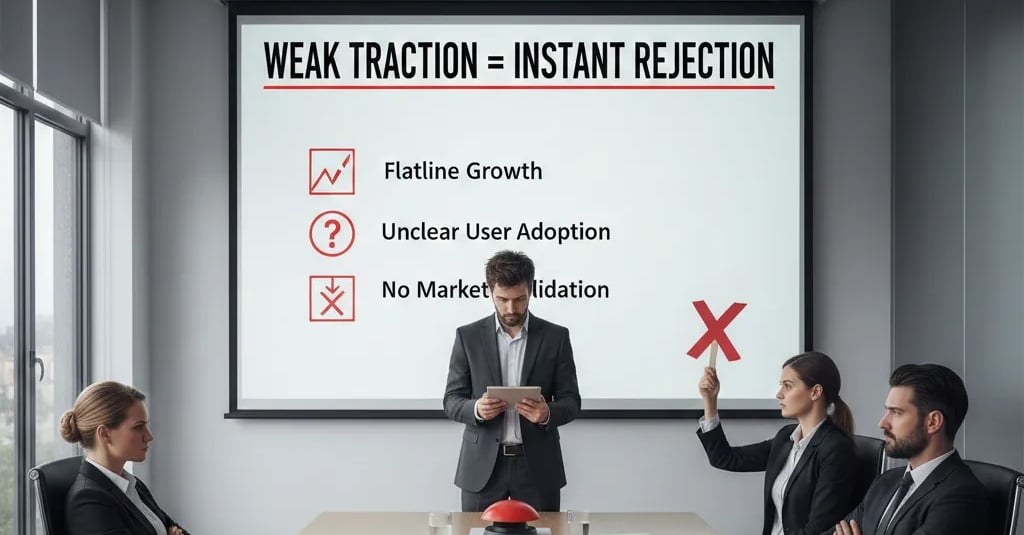
The traction slide is the only place in your deck where you prove causality, not correlation. A VC doesn't care that you have 50,000 users—they care whether those users appeared because of deliberate, repeatable action or because you spent $200K on Facebook ads during a 2021 liquidity surge. Weak traction presentation is defined as any slide that shows growth without explaining the engine that produced it.
Here's the red flag scenario: You show a hockey stick graph of MRR growing from $10K to $150K over 18 months. No cohort retention curves. No unit economics breakdown. No explanation of whether growth came from new customer acquisition, expansion revenue, or both. The VC sees this and thinks: "This founder either doesn't track the metrics that matter, or they're deliberately hiding churn." Either interpretation ends the conversation.
The psychological driver behind this error is founder ego mixed with bad advice from accelerators. You've been told that "momentum" is what matters, so you optimize for the steepest possible growth curve rather than demonstrating control over the underlying levers. The VC interprets this as operational immaturity—you're a feature team, not a business.
Why Aggregate Growth Metrics Are Financially Meaningless
Let's prove why your current traction slide is destroying your valuation using basic Series A math. VCs value SaaS companies at 8–12x ARR only if the unit economics support predictable, capital-efficient growth. If you can't prove that each incremental dollar of revenue costs less than $1.00 to acquire and retain, your business has no enterprise value at the Series A stage.
Here's the forensic breakdown:
You show: $150K MRR with 40% month-over-month growth
VC calculates: $150K × 12 = $1.8M ARR
Valuation ceiling (10x multiple): $18M pre-money
But the VC asks: "What's your CAC payback period?"
You answer: "We're not tracking cohort-level CAC yet, but blended CAC is around $800"
VC thinks: "If CAC payback is >12 months and they don't know LTV, this company will burn $3M before they figure out whether the business model works"
Actual valuation the VC assigns: Zero. They won't price a Series A when the founder can't prove the revenue is profitable to acquire.
The math is brutal: A founder who shows $1.8M ARR without unit economics gets the same term sheet as a founder with $0 ARR—because neither can prove they've discovered a scalable go-to-market engine.
The VC-Grade Traction Architecture: How to Build Proof of Repeatability
The solution isn't adding more metrics—it's reconstructing your traction slide to answer the only question that matters: "Can this founder deploy $5M and turn it into $15M of enterprise value in 24 months?" Here's the step-by-step protocol.
Before: The Weak Version
You show a single graph of cumulative revenue over time, labeled "Traction & Growth." You mention you have "low churn" and "strong unit economics" in your verbal pitch. The VC has to interrupt and ask for CAC, LTV, and payback period data—which signals you don't know what metrics matter.
After: The VC-Ready Version
Your traction slide has three visual components that prove causality:
1. Cohort Retention Curves (Top Third of Slide)
Show 6-month retention curves for your last four customer cohorts. This proves product-market fit. A VC looks for retention curves that flatten above 80% by Month 6. If earlier cohorts retained at 65% and recent cohorts retain at 85%, you've proven you're learning and iterating.
2. Unit Economics Table (Middle Third)
Display a simple grid:
CAC: $680 (blended across all channels)
LTV: $4,200 (based on 24-month average customer life × $175 ARPU)
LTV:CAC Ratio: 6.2x
CAC Payback Period: 4.8 months
This single table is worth $3M in valuation. You've just proven that every dollar you spend on acquisition returns $6.20 in lifetime value, and you recover the acquisition cost in under five months. A VC can now model what happens when they give you $5M: you'll deploy it into paid acquisition at a 6x return, which justifies a 10x ARR multiple.
3. Growth Decomposition (Bottom Third)
Break down MRR growth into three bars:
New customer acquisition: +$60K MRR
Expansion revenue (upsells/cross-sells): +$25K MRR
Churn: -$15K MRR
Net New MRR: +$70K
This proves you understand the three levers of SaaS growth. The VC can now ask second-order questions ("What's driving the 18% expansion rate?") instead of first-order questions ("Do you know your churn rate?"). You've graduated from "pitch meeting" to "diligence conversation."
Apply the "Rule of 40" Filter
Before you finalize your traction slide, calculate: Growth Rate + Profit Margin. For early-stage companies, substitute "Profit Margin" with "Negative Burn Multiple." If your growth rate is 120% YoY and your burn multiple is -2.5x (meaning you burn $2.50 for every $1 of new ARR), your Rule of 40 score is 120 - 250 = -130. You fail. A passing score at Series A is anything above 0. If you're at 80% growth with a -1.2x burn multiple, your score is 80 - 120 = -40—still failing, but close enough to fund if the roadmap shows clear path to efficiency.
Three Fatal Errors Founders Make While Attempting to Fix Traction Slides
Death Trap #1: Showing Too Many Metrics
Founders panic and create a 12-metric dashboard (DAU, WAU, MAU, NPS, viral coefficient, customer satisfaction score). This signals confusion, not sophistication. VCs want three metrics: CAC, LTV, and retention. Everything else is noise.
Death Trap #2: Using 2021 Benchmarks in 2026
You cite a SaaS company that raised at 20x ARR in 2021 and argue your 8x ask is "conservative." The VC knows that company is now trading at 4x ARR and has laid off 40% of its workforce. 2026 multiples for profitable SaaS are 8–10x. For unprofitable SaaS, they're 3–5x. Calibrate accordingly.
Death Trap #3: Fabricating Cohort Data You Don't Actually Track
If you don't have real cohort retention data, do not invent it for the pitch deck. VCs will ask for the raw data in diligence, and when the numbers don't match, your deal dies instantly. Better to admit "we're implementing cohort tracking this quarter" than to get caught in a lie during diligence.
Why Fixing This Single Slide Adds $2M to Your Pre-Money Valuation
If you fix your traction slide using this protocol, you're not just improving a PowerPoint—you're changing the VC's mental model of your risk profile. A founder with clean unit economics and cohort retention data gets valued 40–60% higher than a founder with the same ARR but no proof of repeatability. The math: $1.8M ARR at a 6x multiple (unproven model) = $10.8M valuation. $1.8M ARR at a 10x multiple (proven unit economics) = $18M valuation. You just unlocked $7.2M in enterprise value by restructuring one slide.
This exact traction architecture—cohort curves, unit economics tables, growth decomposition—is pre-built inside the Slide-By-Slide VC Instruction Guide, which is one component of the full system that replaces a $5K fundraising consultant. It includes the specific Excel models VCs use to reverse-engineer your traction data, plus the 16 VC-quality AI prompts that generate pitch deck copy in the same clinical language partners actually use in IC meetings. The system costs $497 to filter out founders who aren't serious about raising institutional capital. If you want to deploy the complete Series A execution infrastructure, it's available now.
The alternative is spending 60 hours reverse-engineering your own unit economics dashboard, then learning through rejections that you're still presenting the wrong metrics. You'll eventually figure this out—after burning three months of runway and missing your optimal fundraising window. Most founders learn this the expensive way. You don't have to.
For the full forensic breakdown of every slide that kills deals, read how VC pitch decks really work in 2026—and why most founders get them wrong. That's the complete system. This is one surgical fix inside it.
Funding Blueprint
© 2026 Funding Blueprint. All Rights Reserved.