How Decks Lower Execution Risk Through Traction Proof
Vanity metrics are a $3M valuation penalty. A forensic audit of Traction Proof: Why VCs reject 'Growth Theater' and the exact unit economics (LTV:CAC) that lower execution risk.
1.5 HOW PITCH DECKS HELP INVESTORS REDUCE RISK
1/28/20265 min read
How Decks Lower Execution Risk Through Traction Proof
Your metrics are lying to you, and the Series A check you think is coming is about to evaporate. The average founder spends 14 hours perfecting their "Team" slide while their traction data screams "execution risk" in a language VCs fluently understand but founders refuse to learn. This isn't about storytelling. It's about proving you can execute before someone writes a $5M check. As part of the foundational layer covered in how pitch decks help investors reduce risk, traction slides function as forensic evidence of execution capability—not marketing collateral.
Why Vanity Metrics Are a $3M Valuation Penalty
Here's what kills fundraises: presenting traction metrics that measure activity instead of value capture. When a VC sees "500,000 app downloads" without corresponding revenue, retention, or engagement data, they're not seeing traction. They're seeing a $200,000 CAC gamble that hasn't converted to enterprise value.
The "Red Flag" Scenario: A founder presents Monthly Active Users climbing from 10,000 to 75,000 over six months. The slide looks impressive. The VC immediately asks about cohort retention at Day 30. Silence. The founder pivots to "viral growth potential." The meeting ends 12 minutes later. What the VC just diagnosed: this founder is optimizing for screenshots instead of unit economics, which means they'll burn capital on growth that doesn't compound.
Psychological Audit: Founders default to vanity metrics for two reasons. First, ego—MAU growth feels like progress and generates congratulatory Slack messages. Second, most pre-Series A founders are advised by people who've never sat on the LP side of a fund. The advice they receive ("show hockey stick growth!") is directionally correct but mechanically lethal. VCs don't fund growth. They fund profitable growth channels that survive CAC inflation.
Why Traction Without Economics Is Execution Risk
Let's quantify the difference between traction theater and execution proof. Assume two SaaS companies raising Series A:
Company A (Vanity Metrics):
100,000 total users
$50,000 MRR
15% Month-1 retention
CAC: $180
LTV calculation: impossible (churn kills it before Month 6)
Company B (Execution Proof):
8,000 total users
$52,000 MRR
78% Month-6 retention
CAC: $240
LTV: $1,890
LTV:CAC ratio: 7.9x
Company A raised zero capital. Company B closed $4.2M at a $22M pre-money valuation.
Here's the logic breakdown:
Step 1: VCs reverse-engineer your burn multiple (Net Burn ÷ Net New ARR). Company A is adding $15K MRR/month while burning $120K = 8.0x burn multiple. Anything above 2.5x is a red flag in 2026.
Step 2: They calculate payback period (CAC ÷ Monthly ARPU). Company A: undefined (users don't monetize). Company B: 3.8 months.
Step 3: They model dilution at Series B. If you can't prove CAC payback under 12 months, they assume you'll need a bridge round, which means their Series A equity gets crushed.
The traction slide isn't proving you have users. It's proving you've discovered a repeatable, profitable customer acquisition motion. If you can't show that math, you're asking investors to fund your R&D phase, which is a seed-stage thesis, not a Series A one.
The Execution-Proof Traction Framework
Here's how to rebuild your traction slide to eliminate execution risk perception.
Before: The Weak Version
"1.2M app downloads"
"Featured in TechCrunch"
"4.8-star App Store rating"
Revenue chart showing $0 → $80K MRR over 18 months
VC Translation: Paid marketing spend with no evidence of organic defensibility or customer love. High probability this revenue disappears the moment they stop spending on Meta ads.
After: The VC-Ready Version
Slide Title: "Proof of Repeatable Growth: 91% Gross Retention, 6.2x LTV:CAC"
Content Structure:
Section 1 — The Core Metric:
"Q4 2025: $147K MRR (+38% QoQ)"
"Gross Revenue Retention: 91%"
"Net Revenue Retention: 118% (expansion revenue from existing accounts)"
Section 2 — The Unit Economics:
"Blended CAC: $340 (paid + organic)"
"ARPU: $68/month"
"LTV (24-month horizon): $2,108"
"Payback Period: 5 months"
Section 3 — The Proof of Repeatability:
"Last 90 days: 47 new logos, 89% from outbound SDR motion (repeatable channel)"
"Sales Cycle: 23 days (median)"
"Win Rate (demo → close): 34%"
Section 4 — The Risk Mitigation Evidence:
"Churn Analysis: 82% of churn occurs in first 60 days (onboarding fix underway, early data shows 60% reduction)"
"Customer Concentration: Top 10 customers = 18% of ARR (diversified)"
This version answers the execution risk question before the VC asks it. You're not claiming traction—you're demonstrating it through metrics that correlate with venture-scale outcomes.
The "Rule of 40" Filter
If your slide doesn't pass this test, you're not ready for institutional capital:
Formula: (Revenue Growth Rate %) + (EBITDA Margin %) ≥ 40%
If you're burning cash (negative EBITDA), your growth rate needs to compensate. Growing at 60% with -20% EBITDA margin = 40 (pass).
If you're growing at 25% with -30% EBITDA margin = -5 (fail—this is a zombie company).
This isn't a suggestion. Sequoia Capital published internal memos in 2023 stating they won't Series A-fund companies below 35 on this metric unless there's deep tech defensibility. In 2026, the bar moved to 40.
Red Flags Founders Create While "Fixing" Their Traction Slide
1. Over-Indexing on Gross Metrics Without Cohort Analysis
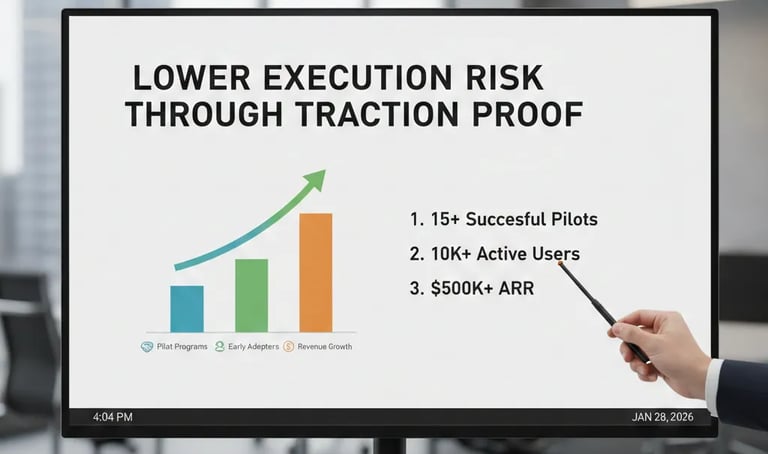
Showing "$500K ARR" is useless without cohort retention curves. VCs will assume your Month 1 cohort has 30% retention by Month 6 (the SaaS average). If your actual retention is 65%, you're leaving money on the table by not showing it. If it's 18%, you're about to get exposed in diligence.
2. Using 2021 Comparables for 2026 Rounds
A founder recently told me their $180K MRR qualified them for a $15M pre-money Series A because "that's what Notion's metrics were in 2019." Wrong. Cost of capital in 2026 is 3.2x higher than 2021. The same traction buys you 40% less valuation. Adjust your anchoring.
3. Hiding CAC Payback Period in Appendix Slides
If your CAC payback is 18 months, putting it on Slide 47 doesn't make it disappear. VCs will find it in diligence and re-anchor the entire valuation conversation around it. If your payback is long, lead with it and explain the strategic rationale (enterprise deals, high LTV justification). Hiding it signals you don't understand your own business.
Why This Single Slide Determines Your Pre-Money Valuation
Fix your traction slide and you unlock $800K to $1.2M in additional pre-money valuation. Here's why: VCs model your Series A equity at exit. If they believe your CAC economics are broken, they'll lowball the entry price to compensate for bridge-round dilution risk. Show them a 6x LTV:CAC ratio with 12-month payback, and they'll pay full price because their exit model holds at the original ownership percentage.
This isn't theoretical. The difference between "good traction" and "execution-proof traction" is the difference between raising at $8M pre-money and $12M pre-money on the same $450K ARR base.
For the complete system on building a deck that eliminates execution risk across all 12 slides, see how VC pitch decks really work in 2026—and why most founders get them wrong.
The Efficiency Hack: You can spend 40 hours reverse-engineering your cohort data, building LTV models in Google Sheets, and debugging your retention SQL queries—or you can plug your raw data into The AI Financial System inside the $5K Consultant Replacement Kit. It auto-generates the exact traction metrics VCs require (LTV:CAC, Burn Multiple, Rule of 40 scoring, cohort retention curves) in under 90 minutes. The kit is $497 and includes the slide-by-slide VC instruction guide that shows you which metrics to put where. If you're pre-revenue or your metrics don't support a Series A thesis yet, save the money. If you're at $200K+ ARR and burning capital to grow, this is the fastest path to a fundable deck.
Funding Blueprint
© 2026 Funding Blueprint. All Rights Reserved.