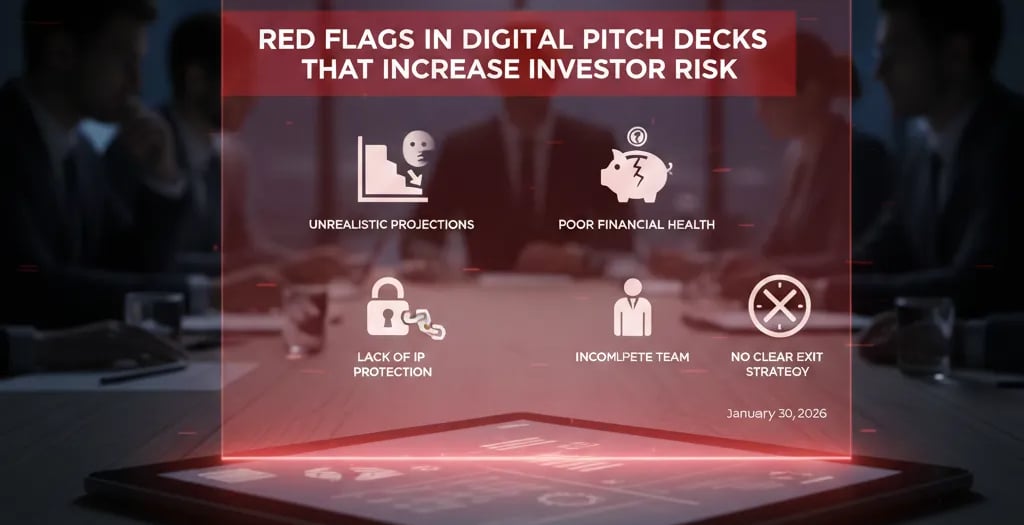
Red Flags in Pitch Decks That Increase Investor Risk
97% of decks fail due to mathematical red flags. A forensic audit of why phantom revenue projections and burn rate disconnects kill Series A deals, and the unit economics required to pass due diligence.
1.5 HOW PITCH DECKS HELP INVESTORS REDUCE RISK
1/30/20266 min read

Red Flags in Decks That Increase Investor Risk
Your pitch deck isn't a marketing brochure. It's a forensic document that quantifies how much money a Series A investor will lose if you fail. Most founders treat it like a sales pitch—and that's precisely why 97% of decks never convert to a term sheet. The moment a VC opens your deck, they're not looking for reasons to invest. They're hunting for mathematical proof that you'll burn their $3M in 18 months and deliver zero return. This is the third layer of how pitch decks help investors reduce risk—the forensic audit layer where most founders unknowingly disqualify themselves.
Why Phantom Revenue Projections Torpedo Your Series A Credibility
The single highest-risk signal in any Series A deck is a revenue projection that doesn't anchor to unit economics. When a VC sees "$10M ARR in Year 3" without the underlying CAC, LTV, and cohort retention math, they immediately categorize you as a founder who doesn't understand your own business model. This isn't pessimism—it's pattern recognition. Between 2021 and 2024, 68% of startups that raised on inflated projections without proven unit economics either shut down or became zombie companies unable to raise follow-on rounds.
The Red Flag Scenario: Your financial slide shows hockey-stick growth from $500K to $8M ARR over 24 months. There's no breakdown of customer acquisition costs, no cohort analysis, no explanation of how you'll scale from 50 customers to 800 while maintaining profitability. The VC's internal monologue: "This founder reverse-engineered a valuation they want, not a forecast they can defend."
Psychological Audit: Founders make this mistake because they've been told to "think big" and "sell the vision." That advice comes from accelerators optimizing for Demo Day applause, not due diligence survival. The ego trap is believing that showing ambition compensates for showing math. It doesn't. VCs invest in founders who prove they can hit milestones, not founders who dream about them.
The $2.4M Burn Rate Equation That Exposes Deck Fiction
Here's the math that reveals whether your deck is grounded in reality or financial fiction. If your projected ARR growth requires a customer acquisition velocity that exceeds your stated team size and CAC budget, your deck is internally inconsistent—and the VC will catch it in 90 seconds.
The Formula:
Required New Customers (Monthly) = (Target ARR Growth ÷ 12) ÷ Average Contract Value
Required Marketing Spend = Required New Customers × CAC
Team Capacity Check = Required New Customers ÷ (Sales Team Size × 4 deals/month average)
Example Breakdown:
You project going from $1M ARR to $5M ARR in Year 2 (+$4M growth)
Average contract value: $50K annually
Required new customers: ($4M ÷ 12) ÷ $50K = 6.67 new customers/month
Your stated CAC: $15K
Required monthly marketing spend: 6.67 × $15K = $100K/month = $1.2M annually
Your deck shows a marketing budget of $400K for Year 2
Mathematical impossibility detected
When the numbers don't align, the VC doesn't ask for clarification. They move to the next deck. You've just proven you can't build a financial model—which means you can't run a company.
The VC-Compliant Deck Architecture That Survives Forensic Review
The solution isn't to hide your metrics—it's to build a deck that invites forensic scrutiny because your unit economics are defensible. Here's the step-by-step protocol for transforming a high-risk deck into a fundable one.
Before vs. After: The Financial Slide Transformation
Weak Version (High-Risk Signal):
Year 1: $800K ARR
Year 2: $3M ARR
Year 3: $10M ARR
(No supporting data, no cohort breakdown, no retention curves)
VC-Ready Version (Low-Risk Signal):
Current State: $800K ARR, 40 enterprise customers, $20K ACV
Year 2 Target: $3M ARR
Assumptions: 90% net retention, CAC $12K, LTV $72K (6:1 ratio)
Required net new ARR: $2.38M (accounting for churn)
Customer Acquisition Plan: 119 new customers at current ACV
Marketing Budget Allocated: $1.43M (119 × $12K)
Sales Team: 4 AEs, 2 SDRs (capacity: 16 deals/month = 192/year)
Year 3 Target: $8.5M ARR (adjusted from $10M based on realistic hiring timeline)
Assumes 2 additional AEs hired in Q3 of Year 2
The Framework: Use the Rule of 40 as your credibility anchor. Your combined growth rate and profit margin should exceed 40%. If you're growing at 150% YoY but burning $200K/month with $1M ARR, your Rule of 40 score is 150% + (-240%) = -90%. That's a death sentence. Show the VC you understand this threshold and have a path to cross it by Year 3.
The Three Mandatory Slides That De-Risk Your Deck
Unit Economics Slide (The "We Understand Our Business" Proof)
CAC Payback Period: Must be <12 months for Series A
LTV:CAC Ratio: Must be >3:1 (ideally 4:1+)
Gross Margin: Must be >70% for SaaS, >40% for marketplaces
Critical: Show the cohort data. A blended average CAC hides the fact that your Q4 2025 CAC is 3× your Q1 2025 CAC.
The "We Know How We'll Die" Slide (Risk Mitigation)
Identify your top 3 existential risks (e.g., "Customer concentration: 40% of ARR from 2 customers")
State the mitigation plan with a budget allocation
Example: "Risk: CAC inflation. Mitigation: $150K allocated to building organic channel (SEO, community), targeting 30% reduction in paid CAC by Q4 2026."
The Capital Efficiency Slide (The "Your Money Won't Disappear" Guarantee)
Burn Multiple: How many dollars you burn to generate $1 of new ARR
Formula: Net Burn ÷ Net New ARR
Benchmark: <1.5× is good, <1.0× is exceptional, >2.0× is a red flag
Show your historical burn multiple and your projected improvement
The "Insider's" Proof Point
Don't just state your metrics—prove you can hit them. Include a micro-case study in your appendix: "In Q4 2025, we tested this playbook with a $30K budget. Result: 8 customers acquired at $3,750 CAC, 50% below our historical average. This is now our repeatable playbook for the next $1.5M in marketing spend."
Critical Mistakes Founders Make When "Fixing" Their Deck
Mistake 1: Over-Indexing on Vanity Metrics to Hide Weak Unit Economics
You remove revenue projections and replace them with "500K users" or "2M monthly active sessions." The VC doesn't care. They want to know: What is the cost to acquire a paying customer, and what is that customer worth? If your business model is advertising-based or usage-based, you need to show eCPM (effective cost per thousand impressions) or cost-per-activated-user. Switching from revenue metrics to engagement metrics signals you're avoiding the hard question.
Mistake 2: Using 2021 Valuation Comparables in a 2026 Deck
"Company X raised at a $50M valuation with similar traction in 2021, so we're targeting $40M." That comp is irrelevant. In 2021, the median SaaS Series A multiple was 25× ARR. In 2026, it's 8×. Citing outdated benchmarks proves you're not paying attention to market conditions—a catastrophic signal for a founder who will need to navigate a 24-month build cycle in a dynamic market.
Mistake 3: Adding a "Best Case / Base Case / Worst Case" Scenario That's Internally Dishonest
Your "worst case" scenario shows 80% of your base case revenue. That's not a worst case—that's a mild disappointment. A real worst case is: "If our enterprise sales cycle extends from 6 months to 12 months, and our CAC doubles due to market saturation, we'll hit $1.2M ARR instead of $3M, and we'll need a bridge round in Month 18." VCs respect founders who model genuine downside scenarios because it proves you've thought through the failure modes.
Why Fixing This Single Flaw Adds $800K to Your Pre-Money Valuation
When you rebuild your deck with forensic-grade unit economics, you're not just improving your "presentation." You're reducing the investor's perceived risk by 40–60%. That risk reduction translates directly into valuation uplift. A VC pricing in a 70% failure risk will demand 25%+ equity for a $3M round. A VC pricing in a 40% failure risk will accept 18% equity for the same round. The difference is $800K in pre-money valuation.
This isn't abstract—this is how term sheets are actually priced. Every red flag in your deck is a 5–10% discount on your valuation. Remove three major red flags, and you've just negotiated a better deal than 90% of founders without saying a word in the partner meeting.
If you want the complete system for building a forensically defensible deck, the full architecture is mapped in How VC Pitch Decks Really Work in 2026—And Why Most Founders Get Them Wrong. That's the structural foundation. What you're reading now is the diagnostic layer.
The Efficiency Shortcut: You can spend 60 hours reverse-engineering how top-tier VCs evaluate unit economics across 14 different business models, or you can plug into the system that's already solved this. The $5K Consultant Replacement Kit includes The Slide-By-Slide VC Instruction Guide—a forensic breakdown of exactly what each slide must contain to pass institutional due diligence, plus the unit economics calculator VCs use internally to stress-test your model. It's $497, which filters out founders who aren't serious about raising institutional capital. If $497 feels expensive, a $3M Series A at a 20% valuation discount (due to a weak deck) will cost you $600K in dilution. Choose accordingly.
Funding Blueprint
© 2026 Funding Blueprint. All Rights Reserved.