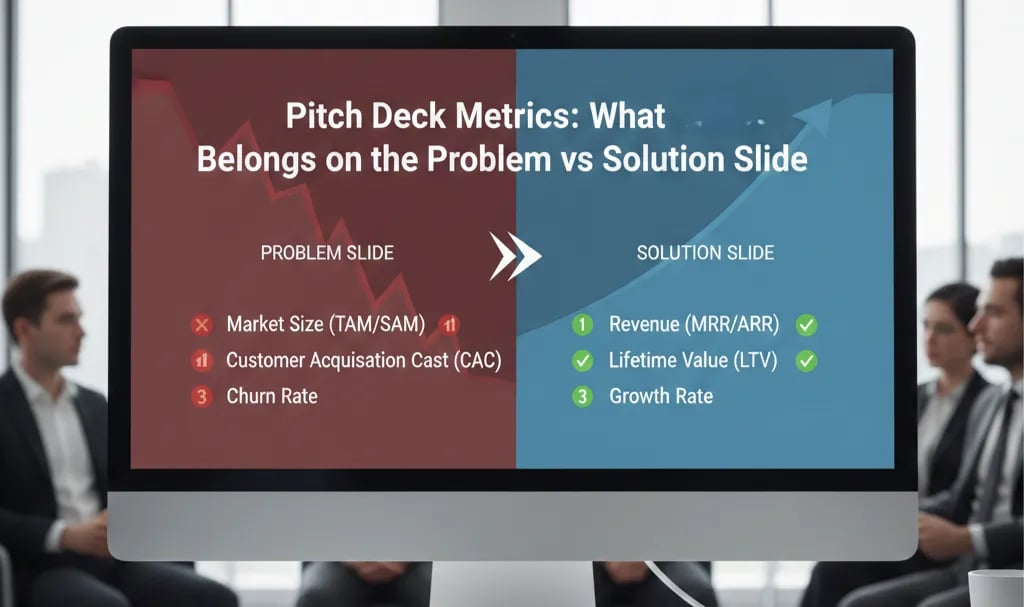
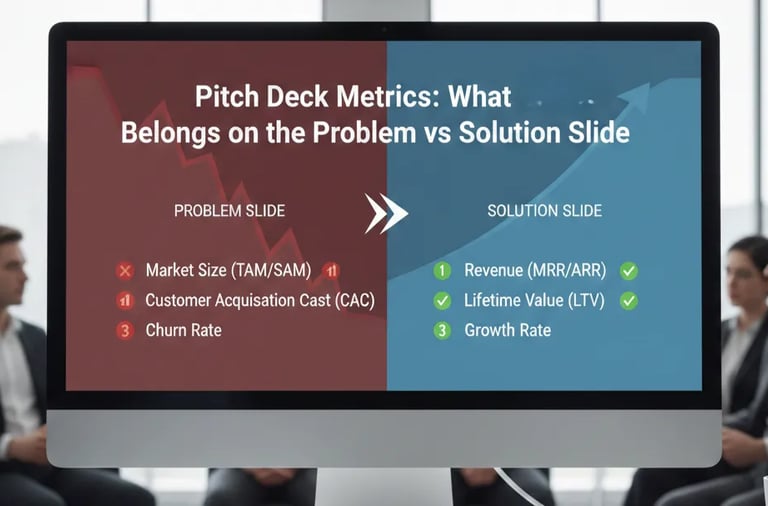
Pitch Deck Metrics: What Belongs on the Problem vs Solution Slide
Stop putting product data on your Problem slide. Metric misplacement kills Series A credibility. Learn the strict VC allocation protocol to fix your deck.
2.6 COMMON FOUNDER MISTAKES ON PROBLEM & SOLUTION SLIDES
2/24/20268 min read
Pitch Deck Metrics: What Belongs on the Problem vs Solution Slide
Most Founders Think Putting More Data in Their Pitch Deck Builds Credibility. It Does the Opposite.
Most founders believe that loading their Problem and Solution Slides with metrics demonstrates rigour. It demonstrates the opposite. A metric placed on the wrong slide does not add evidence — it creates cognitive friction that causes a partner-level reader to question whether the founder understands the distinction between diagnosing a market and proving a product. These are not the same intellectual exercise, and the slides are not interchangeable containers. Placing a retention rate on your Problem Slide or a market size statistic on your Solution Slide is not a minor formatting error. It is a signal that the pitch architecture was built without a structural logic governing what each slide is designed to do to the investor's thinking. This post sits within the broader diagnostic framework of common founder errors on Problem and Solution Slides — and metric misplacement is one of the most silent deal-killers in the set, because it rarely triggers an explicit objection. It just produces a vague sense that the founder does not fully understand their own business.
Why Metric Misplacement Is a Structural Error, Not a Design Preference
The Problem Slide and Solution Slide are performing two entirely different cognitive jobs. Conflating them by distributing metrics without a governing logic destroys both.
The Problem Slide has one function: to create a specific, felt conviction in the VC that a defined group of people are experiencing measurable pain right now, that the pain has a quantifiable cost, and that no adequate solution currently exists. Every metric on this slide must serve that function. The moment a metric on your Problem Slide describes your product, your technology, or your customers' experience with your solution, you have collapsed two distinct arguments into one slide and weakened both.
The Solution Slide has one function: to prove that your product produces a specific, repeatable outcome for the buyer described on the Problem Slide, and that the mechanism generating that outcome is defensible. Every metric here must serve that function. The moment a metric on your Solution Slide describes the size of the market or the severity of the industry problem, you have already lost the sequencing logic that allows a VC to build conviction in steps.
The error is almost always rooted in the same misunderstanding: founders treat the deck as a document rather than an argument. A document can hold information in any order. An argument has a sequence — and that sequence determines whether the listener arrives at conviction or confusion. In the last two quarters, I have reviewed over a dozen decks where the Problem Slide contained the founder's NPS score and the Solution Slide cited industry research on market pain — in every case, the VC's feedback noted "unclear value proposition" despite the deck containing the correct underlying information.
As of Q1 2026, US and UK Series A funds are running structured pre-screening processes where an associate reviews decks before any partner sees them, specifically flagging decks where the narrative logic is internally inconsistent. Metric misplacement is one of the three most commonly flagged structural issues in that pre-screen — which means your deck may be eliminated before a partner ever opens it.
The Misplacement Tax: What Wrong-Slide Metrics Cost in Partner Attention and Diligence Velocity
Attention during a pitch is not a renewable resource. Research on executive decision-making under time constraints consistently shows that cognitive friction — the mental effort required to reconcile inconsistent information — degrades subsequent processing quality. In practical terms: if your Problem Slide forces a VC to mentally recategorise a product metric as a market insight, the next three slides receive degraded attention. You have spent your credibility budget on a sequencing error.
Map the cognitive cost explicitly:
Scenario A — Problem Slide Contains a Product Metric
The founder places "92% of our customers report saving 6 hours per week" on the Problem Slide as evidence of the problem's severity.
VC's cognitive sequence:
"This is a customer outcome stat, not a problem stat."
"How many customers? Is this validated externally or self-reported?"
"If they already have customers, why is this on the Problem Slide?"
"I do not yet know who the buyer is or what the market size is."
Time lost to reorientation: 15–25 seconds. In a 20-slide deck reviewed at 40 minutes, that is a compounding deficit.
Scenario B — Solution Slide Contains a Market Size Statistic
The founder places "$47B total addressable market in workflow automation" on the Solution Slide to contextualise the product's opportunity.
VC's cognitive sequence:
"I already passed the market slide. Why is TAM here?"
"Is this the solution or the market framing?"
"The solution itself has not been described yet."
"This deck is not structured — what else is out of sequence?"
The metric itself may be accurate. Its placement makes the VC question the founder's structural thinking — which is a much more damaging conclusion than a disagreement over the number.
The governing equation:
Metric Credibility = (Correct Data) × (Correct Slide) × (Correct Sequence)
A wrong-slide metric multiplies by zero on the second variable. The data becomes irrelevant because its placement has already eroded trust.
The Metric Allocation Protocol: A Definitive Framework for What Goes Where
This is not a stylistic preference. It is a structural rule set derived from what partner-level readers expect to find — and where they expect to find it.
The Problem Slide: Three Metric Categories That Belong Here
Category 1 — Pain Quantification Metrics. These describe the cost, frequency, or severity of the problem before any solution exists. They must be sourced externally or from customer discovery, not from your product's performance data.
Correct examples:
"Mid-market finance teams spend an average of 22 hours per month on manual close processes." (Industry benchmark — Gartner, Forrester, or primary research.)
"68% of Series B CFOs report that their current FP&A tool does not integrate with their CRM." (Validated through your own discovery calls — state the sample size.)
"Manual reconciliation errors cost mid-market SaaS companies an average of $240K annually in audit remediation." (Third-party data with a named source.)
Category 2 — Status Quo Failure Metrics. These describe why existing solutions are inadequate. They quantify the gap between what the market currently offers and what the buyer actually needs.
Correct examples:
"The leading incumbent takes 14 weeks to implement. The buyer's board cycle is 12 weeks."
"Current tools in this category average 43% user adoption at the 90-day mark."
Category 3 — Market Urgency Signals. These prove the problem is getting worse, not stable — which is the trigger condition that justifies a VC investment now rather than in 24 months.
Correct examples:
Regulatory change timelines
Volume growth in the problem category (support tickets, compliance incidents, failed audits)
Workforce or structural shifts that are accelerating the pain
The Solution Slide: Three Metric Categories That Belong Here
Category 1 — Outcome Metrics. These are the direct, measurable results your customers achieve because of your product. They must be specific, attributed to a defined customer segment, and defensible under a reference call.
Correct examples:
"Customers reduce close time by 34% in the first 90 days. Validated across 23 deployments."
"Average time-to-value: 11 days from onboarding to first outcome milestone."
Category 2 — Retention and Expansion Metrics. These prove the outcome is durable and that the value compounds over time — the primary evidence a VC needs to underwrite NRR assumptions.
Correct examples:
Net Revenue Retention: 118% at 12 months
Logo retention: 94% across 18-month cohort
Expansion revenue as a percentage of new ARR: 31%
Category 3 — Efficiency Metrics That Prove Defensibility. These demonstrate that your mechanism of value delivery is not easily replicated — your data advantage, your integration depth, your time-to-value relative to incumbents.
Correct examples:
"Implementation time: 11 days versus 14-week industry average."
"Our proprietary data layer processes 4.2M events per customer per month — a corpus that would take a new entrant 18 months to accumulate."
The Weak Version vs. VC-Ready Version — Side by Side
Weak Problem Slide Metric (Wrong Category): "Our customers see a 3x ROI within 6 months." This belongs on the Solution Slide. On the Problem Slide, it collapses the problem-solution sequence and tells the VC you are pitching the product before you have established the pain.
VC-Ready Problem Slide Metric: "Finance teams at Series B SaaS companies spend 22 hours per month on manual close processes. At a fully-loaded cost of $95/hour for a senior analyst, that is $25,080 per year, per person — before accounting for error remediation." This quantifies the pain in the buyer's own cost structure. No product is mentioned. The VC is building a conviction about the problem before they have seen a single feature.
Weak Solution Slide Metric (Wrong Category): "The global FP&A software market is projected to reach $3.9B by 2027." This is a market sizing metric. It belongs on the Market or Opportunity slide — not here. On the Solution Slide, it signals the founder does not know what they are trying to prove with this slide.
VC-Ready Solution Slide Metric: "Customers eliminate an average of 18 of the 22 manual close hours within 60 days of deployment. NRR at 12 months: 121%. Current cohort of 23 customers — zero churn." This closes the loop opened on the Problem Slide. The VC can now run the arithmetic: the problem cost $25K per person per year; the solution eliminates 82% of it; NRR at 121% proves the buyer keeps paying and expands. That is a fundable logical sequence.
Three Death Traps in the Metric Allocation Process
Trap 1 — Using your own product data as Problem Slide evidence. If the metric requires your product to exist in order to be true, it is a Solution Slide metric. The Problem Slide must describe a world in which your product does not yet exist. Any metric that implicitly references your customers, your platform, or your outcomes is in the wrong place.
Trap 2 — Treating market size as a solution proof point. TAM, SAM, and SOM belong on a dedicated Market Opportunity slide. Placing them on the Solution Slide to make the product appear more significant is a structural error that trained readers identify immediately. A large market does not prove your product works. Outcome metrics do.
Trap 3 — Citing unsourced benchmarks on the Problem Slide. A metric without a named source on the Problem Slide is not evidence — it is a claim. In a 2025–2026 diligence environment where associates are cross-referencing slide data before partner meetings, an unsourced benchmark will be flagged. If you cannot name the source in the footnote, do not use the number. Use a validated figure from your own customer discovery instead, and state the sample size explicitly.
What Correct Metric Placement Adds to Your Diligence Process Before the First Reference Call
Metric placement is not a cosmetic decision. It is the mechanism by which your logical argument either holds together or falls apart under a partner's line of questioning. A VC who can follow the clean sequence — here is the quantified pain, here is the proven outcome, here is the retention that proves it compounds — does not need to spend the first 20 minutes of your meeting reconstructing your argument. They spend those 20 minutes probing your defensibility, your team, and your expansion logic — which is exactly where you want the conversation. Correct metric allocation compresses diligence time, which compresses the path to a term sheet. For the complete architecture governing how every element of your Problem and Solution Slides must function in sequence, work through the full Series A Problem and Solution Slide framework.
The AI Financial System inside the $5K Consultant Replacement Kit is built to model and validate the exact outcome and retention metrics that belong on your Solution Slide — so you arrive at a partner meeting with numbers that are internally consistent, correctly placed, and stress-tested against the benchmarks a 2026 Series A fund applies during pre-screening. The full Kit is $497. Validate your slide metrics against the standard a Series A analyst uses before your deck leaves your outbox.
Funding Blueprint
© 2026 Funding Blueprint. All Rights Reserved.