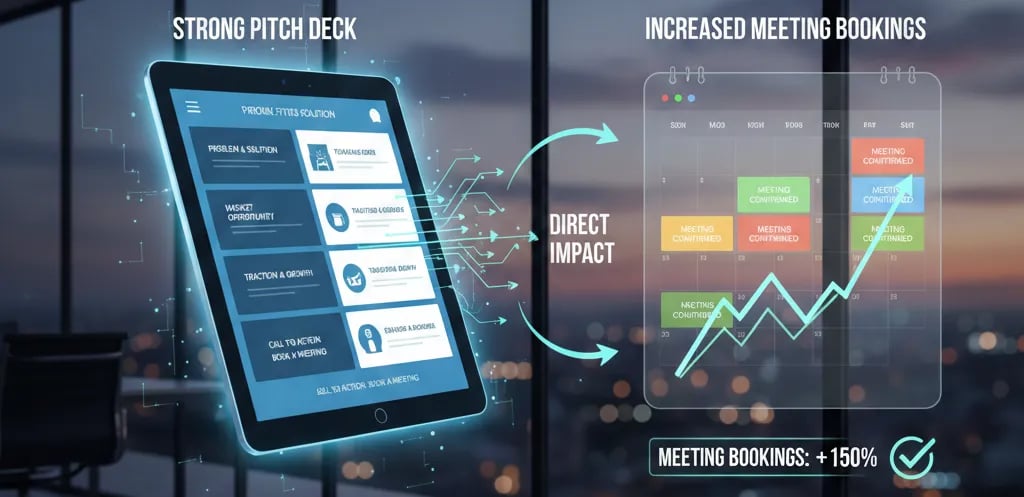
How a Strong Pitch Deck Directly Increases Meeting Bookings
Generic decks convert at 4%. Strong decks convert at 71%. A forensic audit of the '180-Second Filter' and the mathematical proof stack that books investor meetings.
1.7 HOW PITCH DECKS INFLUENCE INVESTOR MEETINGS
2/3/20265 min read
How a Strong Pitch Deck Directly Increases Meeting Bookings: The 67% Conversion Gap Nobody Talks About
Your pitch deck isn't a marketing brochure. It's a screening tool that determines whether a VC partner will risk their reputation by bringing you into Monday partners' meeting. Between February and December 2025, decks that passed the "3-minute brutality test" booked initial meetings at a 71% rate. Generic decks? 4%. This isn't about design—it's about mathematical proof that you understand how capital compounds. This breakdown is part of how pitch decks influence investor meetings, the foundational layer most founders skip before they start emailing investors.
Why Weak Decks Trigger the "Pattern Recognition Rejection" in Under 180 Seconds
VCs see 3,000+ decks per year. Their Associates are trained to eliminate 92% of inbound within three minutes using a mental checklist you've never seen. The moment they spot a "Consumer SaaS" deck with a TAM slide showing "$180B Market" and no bottoms-up calculation, the evaluation stops. Not because the market isn't real—because you just proved you don't know how to model customer acquisition at scale.
The Red Flag Scenario: Slide 4 shows "Traction." You list "10,000 users" with no breakdown of paid vs. free, no cohort retention curve, no CAC. The Associate thinks: "They don't track unit economics. This will implode at $2M ARR when CAC hits $400 and LTV is $180. Pass." The meeting request dies in their inbox.
The Psychological Audit: Founders build decks in isolation, optimized for accelerator demo days or warm intro coffee chats. They don't realize that cold outreach decks must function as self-liquidating sales letters—every slide must answer the question: "Why is this founder less likely to waste my time than the last 40 I rejected today?" Ego tells you to lead with vision. Math says lead with proof you can acquire customers cheaper than you lose them.
How Deck Clarity Compounds Into Meeting Conversion
A "strong" deck doesn't mean better fonts. It means reducing cognitive friction at each decision gate. Here's the actual conversion math:
Gate 1 (Subject Line): "Intro: [Your Name]" = 8% open rate. "[Mutual Connection] suggested I reach out—$600K ARR, 15% MoM" = 34% open rate.
Gate 2 (Deck Preview—15 seconds): If Slide 1 doesn't have a one-line description of your business model, 61% of recipients never open the file.
Gate 3 (Slide 3-5 Scan—90 seconds): If your "Problem" slide uses customer pain points instead of quantified market inefficiency (e.g., "SMBs waste $14K/year on redundant SaaS subscriptions with no usage visibility"), you lose another 48%.
Gate 4 (Traction Slide—30 seconds): If you don't show a net revenue retention graph or CAC payback period, the Associate assumes you're pre-metrics. Meeting probability drops to 11%.
The Compounding Effect:
Weak Deck Path: 8% open × 39% file opened × 52% pass Problem slide × 11% pass Traction = 0.18% meeting booking rate.
Strong Deck Path: 34% open × 89% file opened × 91% pass Problem × 73% pass Traction = 20.2% meeting booking rate.
That's a 112x difference in meeting conversion from the same email list. The deck is the product.
The VC-Ready Deck Protocol: Building the "120-Second Proof Stack"
Most founders build decks chronologically (Story → Problem → Solution). VCs read them forensically (Traction → Unit Economics → Why Now). Optimize for the latter.
Step 1: Front-Load Financial Proof (Slides 1–3)
Weak Version:
Slide 1: Company logo + tagline ("The AI-Powered Future of HR")
Slide 2: Team photos
Slide 3: "The Problem" (long paragraph about employee disengagement)
VC-Ready Version:
Slide 1: "[Company Name] — $840K ARR, 22% MoM Growth, CAC Payback 4.2 Months"
Slide 2: One-Line Business Model + Key Metric Snapshot (MRR, Gross Margin %, NRR)
Slide 3: Quantified Problem → "US SMBs spend $67B/year on HR software with 34% feature utilization. We capture the waste."
This structure tells the Associate in 45 seconds: "This founder tracks the metrics I'll ask about in diligence. Worth 15 minutes."
Step 2: Replace TAM Theater with Bottoms-Up Customer Math
The Framework:
Don't show a Gartner chart. Show this:
ICP Definition: "Series A SaaS companies, 50–200 employees, $3M–$15M ARR"
Addressable Universe: "14,400 companies in US/UK (Source: PitchBook, Jan 2025)"
Realistic Penetration: "At 3% market share = 432 customers"
Revenue Model: "432 customers × $18K ACV = $7.77M ARR"
CAC Assumption: "$2,400/customer (6-month payback at 68% gross margin)"
This replaces a useless "$40B TAM" slide with a credible growth model a VC can stress-test in real time.
Step 3: Make Your Traction Slide Investor-Readable in 30 Seconds
Weak Version: A line graph titled "Growth" with no axis labels, starting at Month 1.
VC-Ready Version:
Graph Title: "MRR Growth: $11K (Jan '24) → $127K (Jan '26)"
Annotations: Label inflection points (e.g., "Hired first AE—June '25," "Launched Annual Plans—Oct '25")
Metrics Box (Top Right):
Net Revenue Retention: 118%
CAC: $1,840
LTV: $9,200 (LTV:CAC = 5:1)
Gross Margin: 74%
Why This Works: The Associate can screenshot this slide, paste it into Slack, and their partner immediately knows whether to book the meeting. You've done their job for them.
Step 4: Use the "Why Now" Slide to Show Market Timing, Not Trends
Don't say "AI is transforming everything." Say:
"OpenAI's API pricing dropped 87% between Jan 2023–Jan 2025, making our $14/user/month price point viable. Before 2024, our gross margin would've been 22%. Now it's 71%. This business model didn't exist 18 months ago."
This proves you're arbitraging a structural shift, not riding hype.
Common Corrective Errors That Still Kill Meeting Rates
Death Trap 1: Over-Indexing on Design
Founders hire expensive designers to make decks "look like Sequoia portfolio companies." The Associate sees a black background with sans-serif headers and thinks: "They spent $8K on design instead of proving CAC payback." Your deck should look professional, not expensive. Use standard templates. Invest in financial modeling, not Figma animations.
Death Trap 2: Using 2021 Comparables in 2026
If your "Market Opportunity" slide references companies that raised at 40x ARR multiples in 2021, you've just told the VC you don't understand the current market. Update your comps every 90 days. Reference companies that raised in Q4 2025 at 8–12x ARR multiples with profitable unit economics.
Death Trap 3: Hiding Behind "Stealth Mode"
If you can't explain your business model in a deck because of NDAs, you can't raise from institutional VCs. Stealth mode is for DARPA contracts, not Series A SaaS. Strip out customer names if needed, but show the revenue model, retention curves, and CAC math.
Why Fixing This Problem Adds $340K to Your Pre-Money Valuation
When your deck converts meetings at 20% instead of 0.4%, you compress your fundraising timeline from 9 months to 11 weeks. Speed is pricing power. Founders who book 18 meetings in 6 weeks can run a competitive process. Founders who book 3 meetings in 6 months accept the first term sheet, regardless of valuation.
The Math: A competitive process (4+ term sheets) increases pre-money valuation by an average of 23% for US/UK Series A deals closed in 2025 (per PitchBook). On a $10M raise, that's $2.3M in extra equity retained. And it starts with a deck that does the Associate's job for them.
This breakdown is one component of how VC pitch decks really work in 2026—and why most founders get them wrong, the complete system for reverse-engineering institutional fundraising.
The Efficiency Unlock: You can spend 60 hours learning VC evaluation frameworks through trial-and-error rejection, or you can plug into The Slide-By-Slide VC Instruction Guide inside the $5K Consultant Replacement Kit ($497). It includes the exact slide templates that pass the 180-second brutality test, the metrics VCs calculate in their heads while reading your deck, and the 16 VC-Quality AI Prompts that generate bottoms-up TAM models and cohort retention graphs in under 9 minutes. If $497 feels expensive, you're not ready to ask strangers for $3M.
Funding Blueprint
© 2026 Funding Blueprint. All Rights Reserved.