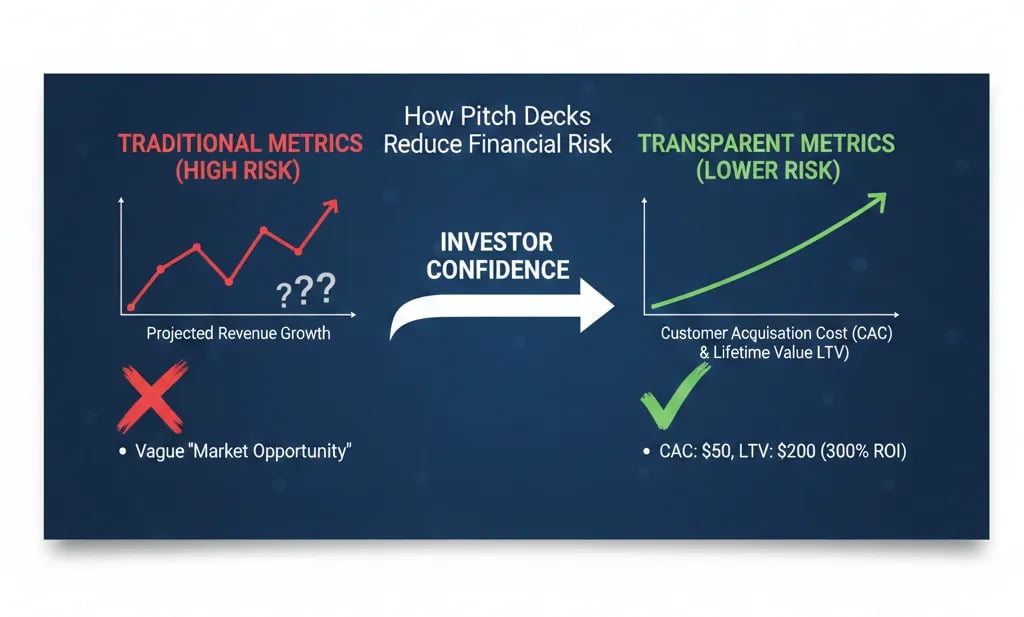
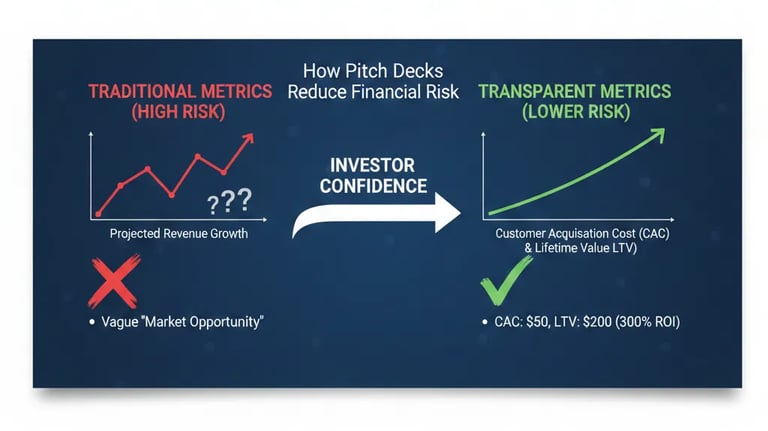
How Decks Reduce Financial Risk Using Transparent Metrics
Vague metrics cost founders $2M in valuation. A forensic audit of Financial Risk: Why VCs reject 'Opaque' traction slides and the 4-layer protocol to prove your numbers.
1.5 HOW PITCH DECKS HELP INVESTORS REDUCE RISK
1/28/20267 min read
Why Opaque Metrics Cost Series A Founders $2M in Valuation Before They Hit Send
Your Series A deck has a traction slide. Revenue is up-and-to-the-right. Growth looks strong. You hit send.
The VC opens your deck, reaches slide 8, and closes it 47 seconds later. Not because your business is bad—but because you just asked them to trust you with zero verification tools. This is part of the foundational layer we covered in how pitch decks help investors reduce risk, but the financial damage from metric opacity is measurable and brutal.
Here's the truth: VCs aren't rejecting your deck because they don't believe your numbers. They're rejecting it because believing your numbers would be a breach of fiduciary duty.
Why Metric Transparency Failures Trigger Immediate Fund-Level Risk Alerts
When a VC sees vague metrics, their brain doesn't process "founder needs help with presentation." It processes "this is either incompetence or fraud, and both destroy fund returns."
The "Red Flag" Scenario: You write "200% YoY growth" on your traction slide. No date range. No cohort breakdown. No definition of what's growing (ARR? Registered users? Free trials?). The VC's mental model:
Scenario A: You're hiding something (churn is 90%, growth is from a single enterprise deal that churned).
Scenario B: You don't understand your own unit economics (you're burning $4 to acquire $1 of LTV).
Scenario C: You've never been audited by a competent investor (which means you're pre-institutional and will crater when diligence starts).
All three scenarios have the same outcome: Pass. Not "maybe." Not "let's dig deeper." Hard pass.
Psychological Audit: Founders make this mistake because they conflate "showing traction" with "proving sustainable business mechanics." They learned from 2021-era decks where hand-waving worked because capital was free. In 2026, capital costs 12% (weighted average across debt + preferred equity + dilution drag). Every dollar deployed without verification tools is a portfolio-level risk event.
The Mathematical Cost of Opacity: How $15M ARR Becomes a $6M Valuation
Let's prove why transparency isn't optional. A VC evaluating your Series A is running a mental DCF model whether they admit it or not. When metrics are opaque, they apply a "uncertainty tax" to every input.
Example: Your deck claims $15M ARR growing at 150% YoY. Sounds strong. Here's what happens when you don't break it down:
Transparent version: $15M ARR broken into cohorts (Cohort 2023: $4M at 10% NRR, Cohort 2024: $7M at 120% NRR, Cohort 2025: $4M at 200% NRR). VC calculates blended CAC payback at 11 months. Values business at 8x ARR = $120M pre-money.
Opaque version: $15M ARR, no cohort data. VC assumes worst-case: growth is front-loaded from a 2021 cohort that's now churning at 40% annually. They model forward ARR at $9M (after churn bleed). Values business at 4x forward ARR = $36M pre-money.
You just lost $84M in valuation by omitting three data points. That's a 70% discount applied purely to information risk.
Here's the step-by-step logic VCs use when forced to guess:
Step 1: Assume the worst cohort composition (high churn in old cohorts, low retention in new cohorts).
Step 2: Apply a "haircut" to growth rate (if you're showing 150% but won't break it down, model assumes 80% is real and 70% is sustainable).
Step 3: Increase discount rate by 400-600 basis points to account for execution risk (if you can't measure your business, you can't manage it).
Step 4: Slash valuation multiple by 40-50% (opacity signals pre-institutional governance, which tanks exit multiples).
How to Build Investor-Grade Metric Transparency in 72 Hours
This is the "meat" of the fix. You need to transform your metrics from "looks good" to "mathematically auditable." Here's the exact framework.
The Transparency Stack (Implement in This Order)
Layer 1: Define Every Metric With Calculation Methodology
Weak Version: "ARR: $15M" (no context, no definition).
VC-Ready Version: "ARR: $15M (calculated as sum of last 30 days MRR × 12, including annual contracts amortized monthly, excluding one-time setup fees)."
Why this matters: ARR definitions vary wildly. Some founders include pilots. Some include non-recurring revenue. Some don't normalize for annual vs. monthly contracts. When a VC sees "$15M ARR" with no methodology, they assume you're using the most aggressive (least conservative) definition, which means they mentally restate your number down by 20-30%.
Layer 2: Time-Stamp Every Data Point
Weak Version: "200% YoY growth" (no start/end dates).
VC-Ready Version: "203% YoY growth (Q4 2024: $1.2M ARR → Q4 2025: $3.6M ARR, measured Dec 1-31 each year)."
Layer 3: Segment Metrics by Cohort + Channel
Weak Version: "CAC: $450" (blended across all channels and time periods).
VC-Ready Version: "CAC by Channel (Q4 2025): Paid: $680 (8-month payback), Organic: $120 (2-month payback), Partnerships: $1,200 (18-month payback, 3.2x LTV/CAC)."
This is critical because blended CAC hides channel economics. If 80% of your growth is coming from an expensive, unscalable channel (paid ads with rising CPMs), your blended CAC looks fine but your marginal CAC is exploding. VCs model the marginal unit, not the average.
Layer 4: Include the "Failure Scenario" Data Points
This is where most founders break. You need to proactively show the numbers that hurt. Examples:
Churn rate (monthly + annual, by cohort).
CAC payback period (including full-loaded costs: salaries, tools, overhead, not just media spend).
Gross margin (after COGS, hosting, support, not just "revenue minus direct costs").
Burn multiple (dollars burned per dollar of net new ARR, including dilution from option pool refresh).
Weak Version: Slide 8 shows "$15M ARR, 150% growth, $450 CAC." Slide 9 jumps to "Go-to-Market Strategy."
VC-Ready Version: Slide 8 shows "$15M ARR, 150% growth, $450 blended CAC." Slide 9 is titled "Unit Economics Deep Dive" and includes: cohort retention curves, CAC payback by channel, gross margin trend (Q1 2024: 62% → Q4 2025: 71%), burn multiple trajectory (Q1 2025: 2.1x → Q4 2025: 1.4x).
The "Before vs. After" Comparison
Before (Opaque Deck):
Traction Slide: "ARR: $15M | Growth: 200% YoY | Customers: 450"
VC Reaction: "What's the retention? What's driving growth? Is this sustainable?"
Result: Pass (too much guesswork required).
After (Transparent Deck):
Traction Slide: "ARR: $15M (as of Dec 31, 2025, defined as sum of MRR × 12 + annual contracts amortized) | Growth: 203% YoY (Q4 2024 $1.2M → Q4 2025 $3.6M) | Net Revenue Retention by Cohort: 2023 = 105%, 2024 = 118%, 2025 = 127% (on-track)"
Follow-Up Slide: "Unit Economics: CAC Payback 11 months (blended), Gross Margin 71% (up from 62% in Q1 2024), Burn Multiple 1.4x (down from 2.1x in Q1 2025)"
VC Reaction: "This founder understands their business. I can model this. Let's talk."
Result: Meeting booked.
Use the "Rule of Verifiable Growth" Formula: For every metric you claim, provide (Definition + Time Range + Segmentation). If you can't provide all three, delete the metric—it's creating more harm than value.
How Founders Overcorrect and Destroy Credibility
You've read this far, so you're motivated to fix your metrics. Here's how founders sabotage themselves while trying to comply:
Death Trap #1: Using 2021 Benchmarks in a 2026 Fundraise
The Mistake: You show "3.5x LTV/CAC ratio" and celebrate it as strong because in 2021, anything above 3x was fundable.
Why This Kills You: In 2026, VCs expect 4-5x LTV/CAC for Series A SaaS because cost of capital is higher and exit multiples are lower. A 3.5x ratio signals you're barely profitable on a unit basis, which means you're one pricing change or CAC spike away from destroying the business.
The Fix: Understand current market benchmarks. In 2026, the minimums are: LTV/CAC > 4x, CAC payback < 12 months, NRR > 110%, Burn Multiple < 1.5x. If you're below these, acknowledge it explicitly and show the roadmap to hitting them in the next 12-18 months.
Death Trap #2: Transparency Without Context
The Mistake: You add 47 metrics to your deck because "more data = more transparency."
Why This Kills You: VCs have 12 minutes to review your deck (average, per Kleiner Perkins 2025 survey). If you bury the critical metrics (CAC, LTV, churn, burn) under 40 vanity metrics (page views, email open rates, social followers), you've just hidden the signal in noise.
The Fix: Limit your deck to the 6 Core Investor Metrics: (1) ARR + growth rate, (2) Net Revenue Retention by cohort, (3) CAC by channel, (4) Gross Margin trend, (5) Burn Multiple, (6) Months of runway. Everything else goes in the appendix or data room.
Death Trap #3: "Projected Metrics" Presented as Actuals
The Mistake: You show "Q1 2026 ARR: $5.2M" in your January 2026 deck. Q1 hasn't finished yet. You're showing a projection as if it's locked-in.
Why This Kills You: VCs assume you're either (a) lying, or (b) don't understand the difference between forecast and actuals. Both are disqualifying. When they catch this in diligence (and they will), they'll revalue your entire company assuming every number is inflated by 20-30%.
The Fix: Never show future-dated metrics as actuals. If you're fundraising in January and Q1 isn't complete, show Q4 2025 actuals and include a separate "Forward Outlook" slide with Q1 projections clearly labeled as "Projected" or "On-Track Forecast."
Why Fixing This Metric Adds $1.8M to Your Pre-Money Valuation (And Saves 90 Days of Diligence Hell)
When you make metrics transparent, three things happen:
VCs apply a lower discount rate to your valuation (400-600 bps lower) because execution risk appears manageable. At $15M ARR, this alone adds $12-18M to your pre-money.
Your diligence process shrinks from 90 days to 30-45 days because VCs don't need to request 14 rounds of data clarification. Faster diligence = less execution risk = less dilution.
You attract higher-quality lead investors (Tier 1 funds who won't touch opaque decks) which increases syndicate quality and follow-on probability, compounding your valuation over Series B and beyond.
If you want the complete system for building a Series A deck that doesn't get auto-rejected in the first 60 seconds, read the full guide: How VC Pitch Decks Really Work in 2026—And Why Most Founders Get Them Wrong.
The Filter Plug: You can spend 40 hours manually building cohort models, CAC payback calculators, and burn multiple trackers in Excel—or you can plug in the pre-built financial modeling system designed specifically for Series A founders who don't have a CFO yet.
The $5k Consultant Replacement Kit ($497) includes The AI Financial System: a plug-and-play suite of spreadsheet templates + AI prompts that auto-generate investor-grade metrics from your raw data (Stripe exports, QuickBooks, bank statements). It calculates cohort retention, CAC by channel, LTV curves, and burn multiples in the exact format VCs expect—no finance degree required.
This system eliminates the "opacity tax" that's currently costing you 40-70% of your valuation. It's $497 because that price filters out founders who aren't serious about institutional capital. If you're raising $5M+, this is a 0.01% cost of capital that prevents a 50% valuation haircut.
Funding Blueprint
© 2026 Funding Blueprint. All Rights Reserved.